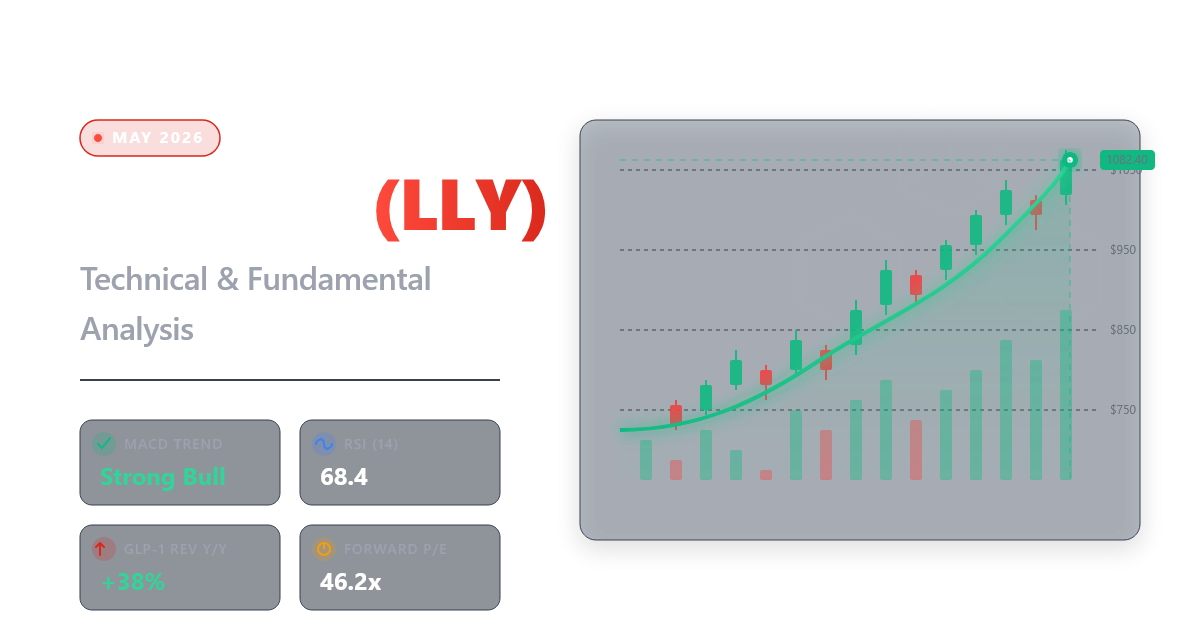
May 25, 2026
Eli Lilly (LLY) — Technical & Fundamental Analysis | May 2026
Overview
Eli Lilly ($LLY) is one of the most closely watched stocks in the market right now, and for good reason. The company is executing at a historically rare level for a mega-cap pharma, combining explosive revenue growth, a deepening pipeline, and market leadership in one of the most exciting therapeutic categories in decades: obesity and metabolic disease.
This article takes a dual approach. We’ll examine what the technicals are saying right now using data pulled directly from the IBKR API, and we’ll layer in the fundamental picture to understand whether the momentum is justified.
—
Live Technical Data (via IBKR API)
As of market close, May 25, 2026
| Indicator | Value |
|---|---|
| Last Close | $1,065.00 |
| SMA 20 | $973.90 |
| SMA 50 | $943.33 |
| SMA 200 | $928.25 |
| RSI (14) | 70.4 |
| MACD | 28.23 |
| MACD Signal | 19.51 |
| BB Upper | $1,086.65 |
| BB Lower | $861.14 |
| Trend | BULLISH |
| RSI Signal | Overbought |
Data fetched via the
ib_insyncPython library connecting to Interactive Brokers TWS. Historical bars used: 1-year daily OHLCV.
What the Chart Is Telling Us
OHLC Price & Volume
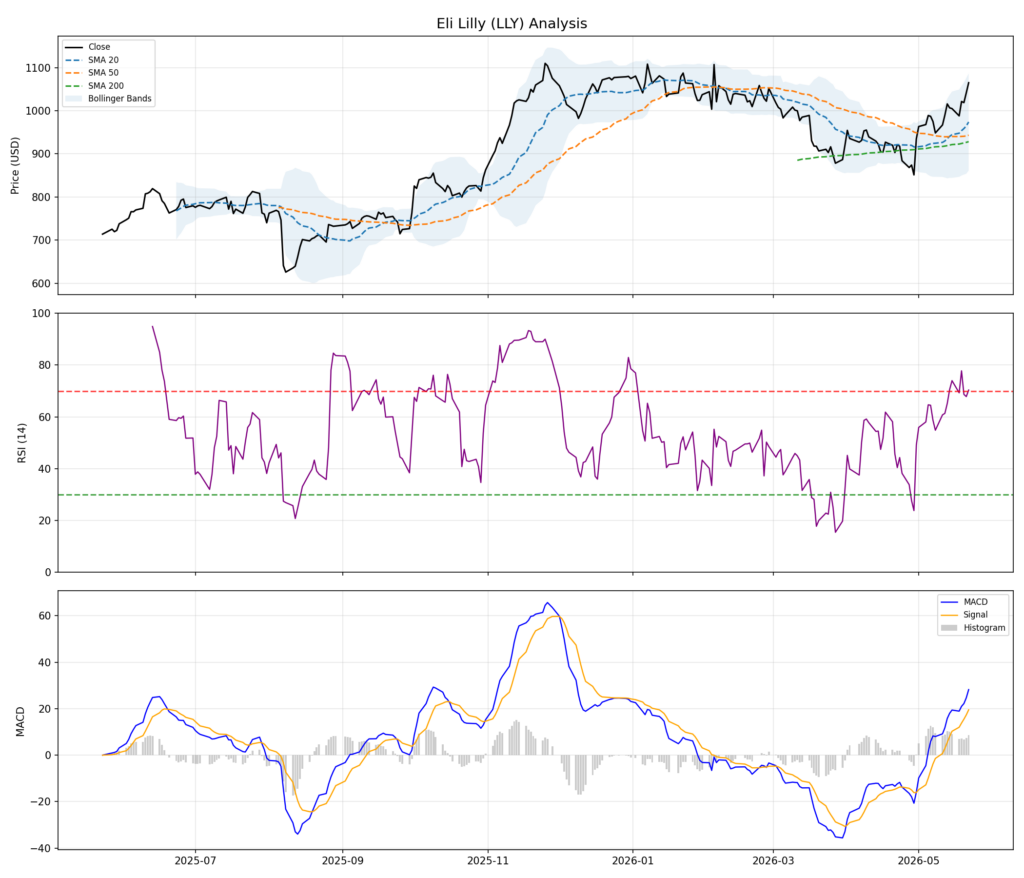
*Green bars = up days, red bars = down days. Blue/orange dashed lines are SMA 20/50.*
Trend: Strongly Bullish
The moving average stack is perfectly bullish — SMA 20 > SMA 50 > SMA 200. This is a classic sign of strong, sustained upward momentum across all timeframes. The stock is trading well above all three moving averages simultaneously, which signals broad institutional participation in the rally.
At $1,065, LLY is sitting roughly $91 above its 20-day SMA and $137 above its 50-day SMA. That’s an extended move — not unusual for a high-momentum name, but worth watching for potential mean reversion.
RSI: Overbought Territory
With an RSI of 70.4, LLY has just crossed into overbought territory on the daily chart. This doesn’t mean the stock is about to sell off — overbought conditions in strong trends can persist far longer than expected — but it does signal that short-term risk/reward is less favorable for new entries.
Traders looking to initiate or add to positions may benefit from waiting for a pullback toward the SMA 20 (~$974) or SMA 50 (~$943) before adding risk.
MACD: Bullish, with Momentum Still Building
The MACD line (28.23) is well above the signal line (19.51), with a positive histogram. This confirms the upward momentum is still accelerating rather than fading. There’s no bearish divergence visible at this stage — a constructive sign for trend followers.
Bollinger Bands: Extended, Near Upper Band
LLY is trading at $1,065, close to the Bollinger upper band at $1,086.65. The wide spread between the upper ($1,086) and lower ($861) bands reflects high recent volatility. Stocks pressing the upper Bollinger Band in a confirmed uptrend often see brief consolidation or a shallow pullback before continuing higher.
Technical Summary
> Trend: Bullish
> Momentum: Strong but extended
> Short-term risk: Elevated — overbought RSI and proximity to BB upper band
> Support levels to watch: $974 (SMA 20), $943 (SMA 50), $928 (SMA 200)
What’s Driving the Fundamentals
1. An Extraordinary Q1 2026
Lilly’s most recent earnings report underscored why this stock commands a premium. Q1 2026 results showed:
–Revenue up 56% year-over-year
–EPS of $8.26 vs. $3.06 a year earlier — nearly a 3x increase
–Full-year revenue guidance raised to $82–85 billion
This kind of earnings acceleration is rare for any company at this scale, let alone a pharmaceutical giant. The primary driver is the tirzepatide franchise — Mounjaro (diabetes) and Zepbound (obesity) — which has exceeded market expectations consistently.
2. Retatrutide: The Next Potential Blockbuster
The biggest near-term catalyst is retatrutide, Lilly’s next-generation obesity drug. Phase 3 data released this week showed an average ~28% body weight reduction at the highest dose — with many patients exceeding 30%, approaching outcomes typically associated with bariatric surgery.
If approved commercially in 2027, retatrutide would represent a meaningful step up from Zepbound’s already-impressive profile, extending Lilly’s product cycle and giving the company another multi-billion-dollar revenue stream.
3. Deep Pipeline — Not a One-Drug Story
One of the strongest arguments for owning LLY at premium multiples is the breadth of its pipeline:
–Oral GLP-1 (orforglipron) — could massively expand the addressable market by removing injection barriers
–Retatrutide — next-gen injectable obesity
–Kisunla — Alzheimer’s treatment
–Oncology and immunology programs in late-stage development
–Cardiometabolic and kidney disease expansions
If oral GLP-1s prove commercially viable, the total addressable market for obesity treatment could expand dramatically beyond current expectations.
4. Manufacturing Advantage
In the GLP-1 space, manufacturing scale is a genuine competitive moat. Lilly has been investing aggressively in production capacity — a critical edge at a time when competitors and potential new entrants still struggle to meet demand.
—
Valuation: The Only Real Bear Case
At a ~$950B+ market cap and ~38x earnings, LLY is not cheap by any traditional metric. This is a growth stock priced for continued execution.
The bull case rests on compounding earnings at an unusually rapid rate for a company of this size. The bear case is straightforward: if growth slows, misses, or faces regulatory headwinds (drug pricing, Medicare reimbursement), the valuation multiple could compress quickly and painfully.
Comparison to Novo Nordisk: Many analysts now view Lilly as the innovation leader in obesity therapeutics. Compared to Novo, Lilly’s efficacy data appears stronger, its pipeline is broader, and product sequencing looks more durable. That premium is real.
—
Key Risks
| Risk Factor | Notes |
|---|---|
| Drug pricing regulation | Political pressure on GLP-1 pricing continues |
| Medicare reimbursement | Coverage expansion could help or hurt depending on negotiated prices |
| Manufacturing disruption | Any supply chain issue would be a negative catalyst |
| Clinical setbacks | Safety or efficacy surprises in retatrutide or orforglipron trials |
| Competition | Future GLP-1 entrants could compress margins |
| Valuation compression | Any growth slowdown could cause a sharp re-rating |
Bottom Line
The technicals and fundamentals are telling the same story for LLY right now: strong, sustained momentum, but extended in the short term.
From a technical standpoint, the stock is in a clear uptrend with bullish moving average alignment and positive MACD momentum. However, RSI at 70.4 and proximity to the Bollinger upper band suggest near-term caution. Patient investors may find better entry points closer to the $940–$975 support zone.
From a fundamental standpoint, Lilly remains one of the highest-quality growth stories in global healthcare. The obesity franchise has years of runway, retatrutide adds another leg to the bull case, and the pipeline depth reduces the risk of a single-product cliff.
Investment assessment:
| Factor | View |
|---|---|
| Long-term outlook | Bullish |
| Near-term technicals | Extended / overbought |
| Valuation | Premium, arguably justified |
| Risk level | Moderate-to-high |
| Best for | Long-term investors comfortable with high-multiple growth |
For those who believe GLP-1-based obesity and metabolic therapies are a decade-long growth platform — and the evidence increasingly supports that view — Lilly remains one of the most compelling core holdings in healthcare, even at today’s prices. The stock isn’t cheap, but the story continues to get stronger.
—
*Disclosure: This article is for informational purposes only and does not constitute financial advice. Technical data was sourced live via the Interactive Brokers API using the `ib_insync` Python library. Fundamental data and analysis referenced from publicly available sources including PR Newswire, Reuters, MarketWatch, and TIKR.*