February 27, 2026
Gold Futures on COMEX: February 2026
Market overview
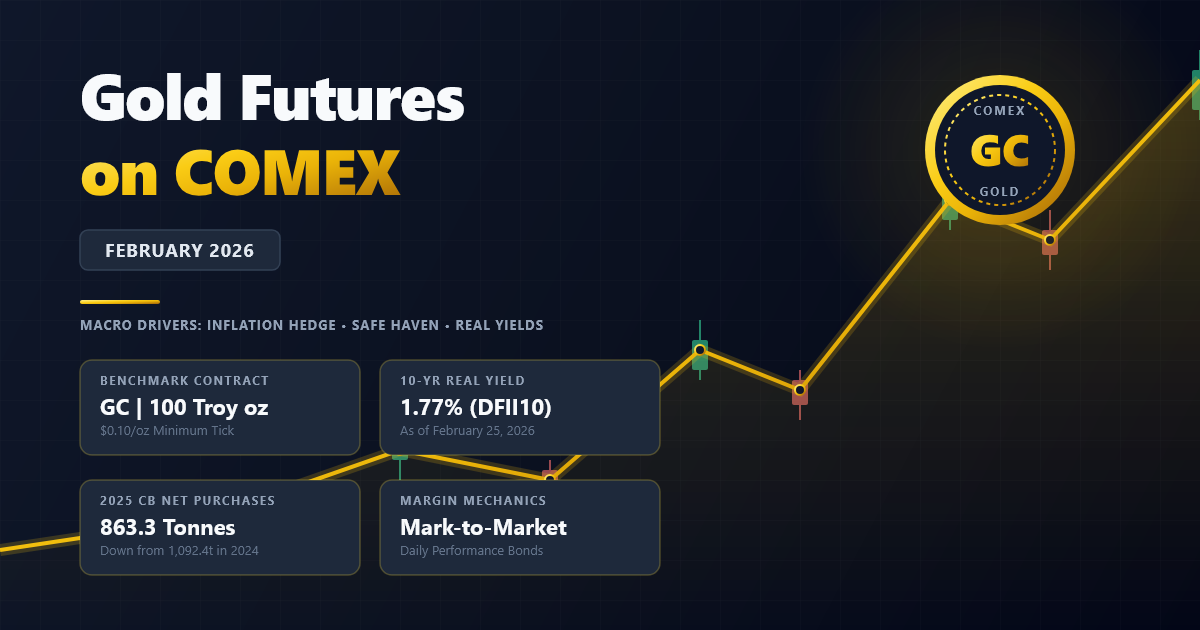
COMEX Gold futures (ticker GC) are the benchmark U.S. gold futures contract under CME Group. The contract is 100 troy ounces, quoted in U.S. dollars and cents per troy ounce; minimum tick is $0.10/oz = $10 per contract (so $1/oz = $100).
Margin mechanics matter for any leveraged implementation. CME defines margins as performance bonds (deposits held at the clearinghouse) and notes requirements vary by product and market volatility, with daily mark‑to‑market driving variation margin flows.
Macro positioning remains anchored to gold’s roles as an inflation/policy‑uncertainty hedge, a conditional safe‑haven, and an asset sensitive to opportunity cost (real yields) and USD dynamics. The World Gold Council attributes 2025 strength to elevated uncertainty, a weaker U.S. dollar, and price momentum, with investors and central banks increasing allocations for diversification and stability. Central bank net purchases were 863.3 tonnes in 2025, down from 1,092.4 tonnes in 2024; the 10‑year TIPS real yield proxy (DFII10) was 1.77% on 2026‑02‑25.
Price action and technical state from OHLCV
The provided GC1 daily OHLCV series spans 2025‑08‑03 to 2026‑02‑25 (143 observations). The close rose from 3428.6 to 5201.5 (+51.7%, author calculation).
Trend structure is asymmetric across horizons (author calculations): short‑term rebound (~+3.7% over the last 5 sessions), medium‑term consolidation (~‑3.9% over the last 20 sessions), and a strong in‑sample long trend (~+44% over the last 120 sessions). Price ends above the 20‑day SMA (~5041) and 50‑day SMA (~4773). A 200‑day SMA cannot be computed from a 143‑day sample; a true 200‑day lens requires more history.
Volatility regime analysis is the headline technical development. The 20‑day rolling standard deviation of log returns (annualized) averaged about ~20% before 2026‑02‑01 and ~56% after; ATR(14) moved similarly in percent terms (author calculations). The shift is concentrated in a late‑January/early‑February shock cluster: ‑9.3% (2026‑01‑29), ‑4.6% (2026‑02‑01), then +6.2% (2026‑02‑02). Treat this as a structural break for stop placement, signal thresholds, and vol budgeting.
Volume and price together imply positioning stress. In this sample, average volume is higher on down days than up days; the late‑January peak close occurred on unusually light volume, followed by high‑volume reversal/liquidation days (author calculation). A simple accumulation/distribution read (e.g., OBV or Chaikin ADL) improved into late February but was choppy around the liquidation cluster, consistent with repositioning rather than steady accumulation (author calculation). Key levels are tightly defined by those shock bars: resistance ~5250–5270, then ~5410 (peak close) and ~5625 (intraday high); support ~4680–4800, then ~4420 (intraday panic low). Momentum is stabilizing: RSI(14) mean‑reverted from mid‑90s into the mid‑60s by 2026‑02‑25, and MACD histogram turned positive in the final two sessions (author calculations).
Beyond OHLCV data that matters quantitatively
Open interest (end‑of‑day outstanding contracts) helps distinguish “new positioning” from short covering and is available via CME’s gold volume/open interest tools. COT from the U.S. Commodity Futures Trading Commission decomposes positioning by trader class (commercials, managed money, etc.), enabling crowding metrics that can condition risk (e.g., reduce size when positioning is extreme).
Term structure (contango/backwardation) is non‑optional for continuous strategies because roll yield contributes to returns; CME’s roll‑yield decomposition formalizes this. Implied volatility adds forward-looking risk information; Cboe Global Markets’s GVZ (derived from options on GLD) is a common implied-vol proxy for volatility targeting and convexity-demand detection. Real yields (DFII10) are available via Federal Reserve Bank of St. Louis, while the U.S. dollar benchmark DXY is maintained by Intercontinental Exchange. Correlations to equities and bonds are regime‑dependent; WGC provides correlation analytics showing state dependence.
Central bank purchases and ETF flows matter when gold trades more like a reserve asset than a pure “rates trade.” Central-bank buying remained high in 2025, and transparent ETF holdings series—especially SPDR Gold Shares—provide a daily demand proxy that can be incorporated into a state model (e.g., as an exogenous flow factor or a conditioning variable for trend quality).
Statistical and quantitative characteristics in the sample
Returns are materially non‑Gaussian. Log returns show negative skew (~‑1.44) and high excess kurtosis (~7.36) (author calculation); worst daily return is ~‑9.3%, best is ~+6.2%. This tail profile favors expected‑shortfall/drawdown‑aware sizing over variance-only scaling.
Drawdowns are concentrated: maximum peak‑to‑trough drawdown is ~‑13.5% (late‑January peak into early‑February trough), and the series remains ~‑3.9% below the peak at 2026‑02‑25 (author calculation). A 60‑day rolling Sharpe (risk‑free assumed 0) is high at the sample end (~2.25, author calculation), but should be discounted in a post‑break high‑volatility regime. Seasonality is not statistically robust over seven months; within-sample month‑end returns are positive across months, but that is not sufficient evidence for tradable seasonality.
Volatility clustering is present: squared returns autocorrelate (lag‑1 ≈ 0.19) and an ARCH test rejects constant variance (p≈0.013) (author calculations). Mean reversion versus trend persistence is horizon‑dependent: price-level filters show persistence (close above SMA50), but a simple predictive regression indicates short-horizon mean reversion after strong 20‑day runs—consistent with pullback entries being more robust than “buy strength” entries during repair phases (author calculation).
Risk factors
The main macro risk is policy-driven repricing of real rates and inflation expectations, centered on the Federal Reserve. WGC notes renewed hawkishness can raise gold’s opportunity cost and pressure near‑term demand, even if hedging motives remain supportive under high uncertainty. Microstructure risk is liquidity and margin shock: futures are marked‑to‑market, and CME emphasizes margin requirements can rise quickly when volatility rises. Dollar strength remains a first‑order headwind for USD‑priced gold. Geopolitical events remain classic jump‑risk catalysts for gold, often producing gap moves and short‑lived correlation breakdowns.
Trade framework
Three systematic templates fit the observed tape: trend-following, breakout/volatility expansion, and trend‑aligned mean reversion.
A trend-following core can use a medium-term filter (close above rising SMA50) with momentum confirmation (MACD improving) and volatility-targeted sizing. Contract mechanics matter: with a 100‑oz multiplier and $10 tick value, end-of-sample notional is roughly $520k per contract, and a first‑pass daily risk proxy is ATR × 100 dollars per contract (author calculation). Breakout sleeves should require participation confirmation (volume and ideally rising open interest) to avoid low‑participation false breaks. Mean‑reversion sleeves should be trend‑aligned (buy pullbacks above the medium-term filter) rather than pure counter‑trend shorts in a structural bull tape.
Risk management should be regime-aware: ATR‑scaled stops, portfolio volatility caps, stress tests for multi‑sigma down days, and a documented roll/curve policy because roll yield can materially affect continuous exposure returns.
Conclusion
From OHLCV alone, GC looks transitional with a bullish bias: trend filters remain positive, but volatility has reset higher since early February and January’s highs remain overhead (author calculation). Key signals to monitor are therefore cross‑market and positioning‑driven: DFII10 (real yields), DXY (USD), GVZ (implied vol), open interest/COT crowding, and the curve/roll-yield backdrop.