May 23, 2026
Gold Futures on COMEX: May 2026
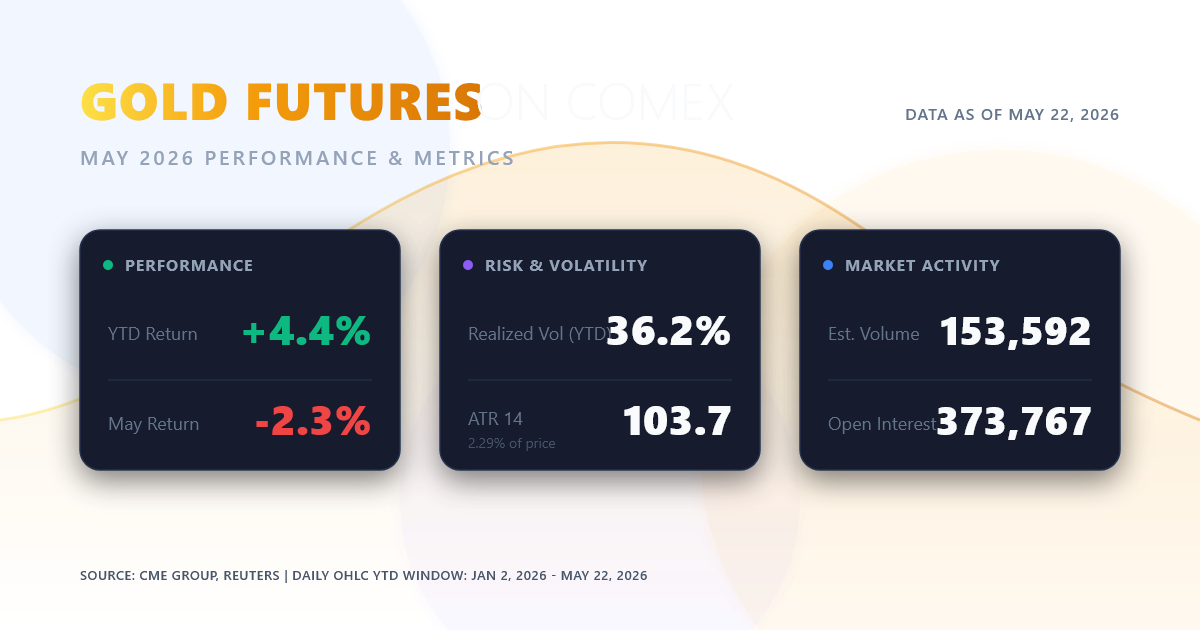
YTD view: still bullish structurally, but no longer in a clean uptrend. Using the supplied daily GC OHLC series, gold is up 4.4% YTD to 4,523.2, yet sits about 19.6% below the late-January blow-off top. May 2026 has been bearish/corrective: the early-month rebound failed under resistance, price stayed below the 50-day MA all month, and momentum rolled over again. The supplied May 22 close is directionally consistent with CME / market references around $4,521-$4,530 for nearby gold futures, while Reuters tied late-May weakness to higher yields, a firmer dollar, oil-driven inflation fears, and renewed Fed hike expectations.
Data and key metrics
Primary input was the supplied GC daily OHLC file covering 2024-12-24 to 2026-05-22; the YTD window used here is 2026-01-02 to 2026-05-22. Official validation/context: CME Group quotes, settlements, and delivery notices; Reuters for macro catalysts. The file does not include volume; an exchange-market snapshot for May 22 showed estimated volume of 153,592 contracts and open interest of 373,767.
| Metric | Value |
|---|---|
| YTD return | +4.4% |
| May return to date | -2.3% |
| YTD realized volatility | 36.2% |
| ATR 14 | 103.7 |
| ATR as % of price | 2.29% |
| 20D / 50D / 200D MA | 4,620.7 / 4,684.0 / 4,374.2 |
| RSI 14 | 39.3 |
| MACD vs signal | -51.9 vs -40.9 |
All table values are author calculations from the supplied OHLC data.
Trend and technical signals
YTD characterization: bullish-to-corrective. The market went parabolic into late January, then shifted into a broad correction. The longer-term structure is still constructive because 50-day MA remains above 200-day MA, but tactically the tape is weaker: price has been below the 50-day since March 18, and the 20-day crossed below the 50-day on March 26. Momentum is soft, not washed out: RSI 39.3 is weak but not oversold; RSI was overbought above 70 during the January spike and briefly sub-30 at the March washout. MACD turned up on May 7, then flipped back down on May 18, confirming that early-May strength was a failed countertrend bounce, not a durable trend reversal.
Support and resistance
Levels below are derived from repeated swing highs/lows, the moving-average cluster, and Fibonacci retracements of the Jan 29 high to Mar 23 low downswing.
| Zone | Role | How derived |
|---|---|---|
| 4,455-4,510 | First support | May 4, 19, and 20 lows; repeated demand shelf |
| 4,332-4,342 | Secondary support | Year-opening close zone around Dec 31 / Jan 2 |
| 4,100 | Major support | Mar 23 YTD panic low |
| 4,683-4,783 | First resistance | 50D MA 4,684 + 38.2% retrace 4,683 + May 12 swing high |
| 4,888-4,918 | Higher resistance | April swing-high cluster |
| 5,411-5,627 | Major overhead resistance | Late-January peak zone |
Charts
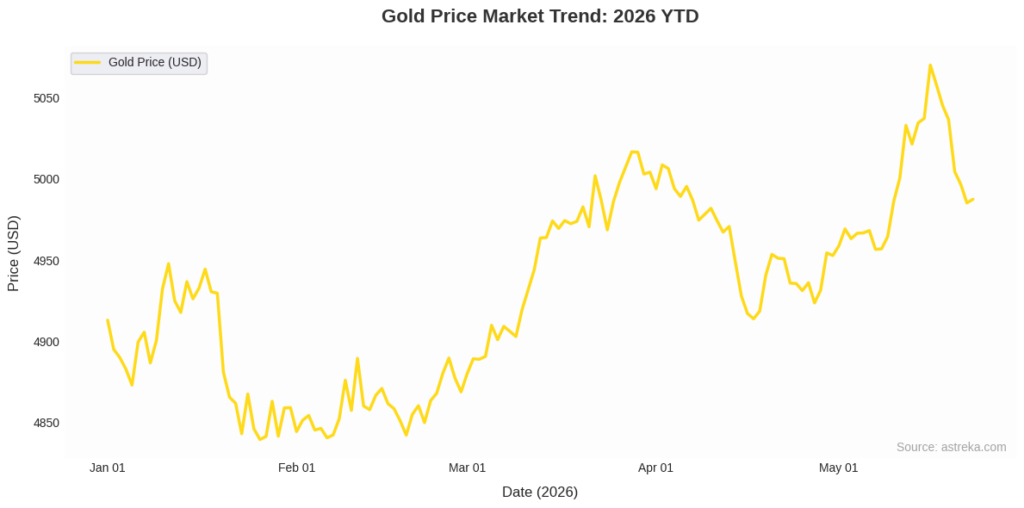
Source: author calculations from the supplied GC daily OHLC file.
Catalysts behind the moves
Three episodes mattered most. First, the late-January surge and reversal: Reuters reported a record-setting spike on Jan. 28 amid economic and geopolitical uncertainty, then a historic Jan. 30 washout as profit-taking, a stronger dollar, and Trump’s pick of Kevin Warsh for Fed chair drove a violent repricing; CME then raised gold margins on Feb. 6, confirming the volatility regime.
Second, the March breakdown: by Mar. 23, gold had slid to a four-month low as oil-driven inflation fears, higher yields, and a stronger rate outlook outweighed safe-haven demand; a partial rebound followed when Trump postponed strikes on Iranian energy assets.
Third, May’s failed rebound: gold jumped on May 6 as U.S.-Iran peace hopes, a softer dollar, and lower oil eased inflation fears, but that rally stalled by May 12 and faded. By May 19-22, yields and the dollar had reasserted pressure, Reuters described a second straight weekly loss, and markets were pricing a meaningfully higher chance of a Fed hike by December.