February 20, 2026
Gold (GC) Market Update: February, 2026
Executive summary
Gold finished the week back >5,000, but the bigger story was volatility: a sharp dip early in the week followed by a quick reclaim as macro headlines re-priced rate expectations and risk sentiment. This week’s “gold bid” looked less like a clean inflation hedge and more like a policy + uncertainty hedge, with growth slowing, inflation still sticky, and geopolitics/tariff ambiguity keeping downside hedges in demand.
What moved gold this week
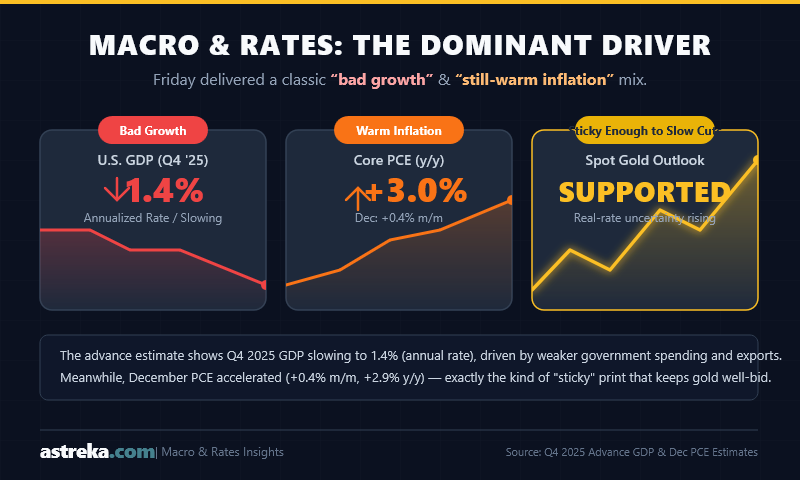
Macro and rates (the dominant driver). Friday delivered a classic “bad growth / still-warm inflation” mix. The advance estimate of U.S. GDP showed growth slowing to 1.4% (annual rate) in Q4 2025, largely reflecting weaker government spending and exports. The same morning, the PCE price index for December accelerated to +0.4% m/m (core also +0.4% m/m) and ran +2.9% y/y (core +3.0% y/y), which is exactly the kind of “sticky enough to slow cuts” print that tends to keep real-rate uncertainty supportive for gold.
Central bank and policy minutes (hawkish tails stay alive). The FOMC minutes (Jan 27–28 meeting) made it explicit that a “two-sided” reaction function is back: several participants said an upward adjustment to the policy-rate target range could be appropriate if inflation stays above target, even as others argued for more cuts once disinflation is “firmly back on track.” In parallel, the Reserve Bank of Australia’s February communications (decision + minutes) reinforced inflation vigilance—useful context for why global real-rate volatility remains an ingredient in the gold tape.
Inflation and jobs backdrop (context from last week). The January CPI report showed +0.2% m/m (seasonally adjusted) and +2.4% y/y, while the January Employment Situation showed +130k payrolls and 4.3% unemployment—not “hot,” but not “weak enough to force cuts,” either.
USD, risk sentiment, and geopolitics. Reuters linked mid-week chop to a combination of U.S.-Iran tensions, thin liquidity (Lunar New Year), and whipsawing rates narratives, with gold repeatedly gravitating around the psychological 5,000 level.
Flows/positioning. The latest official exchange tape still shows heavy participation. The latest final CME daily bulletin available (Feb 18) shows total GC complex open interest ~410k contracts, with the active Apr-26 contract carrying ~281k OI. Weekly positioning data from the CFTC also frames the market as still structurally “owned,” with COMEX gold futures open interest around 404k contracts as of Feb 10.
2026-02-16US holiday + LunarNew Year = thinliquidity2026-02-17RBA minutesreinforce inflationvigilance2026-02-18FOMC minutesreintroduce"two-sided" rate risk2026-02-20US GDP (Q4 advance)+ PCE inflation (Dec)Week of Feb 16, 2026 — Key gold catalystsShow code
Event references: FOMC minutes ; GDP ; PCE ; thin liquidity context .
Technical snapshot
Data note: Technicals below are computed via daily GC OHLC dataset (available range: Dec 8, 2025 → Feb 20, 2026).
Where we are now (as of Feb 20 close):
- Close: ~5,088.9
- 20D SMA: ~5,015.7 (price above)
- 50D SMA: ~4,697.4 (trend still up on this window)
- RSI (14): ~57.5 (neutral-to-bullish; not stretched)
- ATR (14): ~190 (still elevated volatility on a ~5k handle)
Levels that matter (practical, chart-first):
- Near-term support: ~4,855–4,900 (this week’s low zone), then ~4,670 (recent swing area)
- Near-term resistance: ~5,100–5,145, then the late-Jan spike zone around 5,600+
Mini-compare vs Oct 2025 (tone bridge to your prior Astreka post):
| Metric | Oct 2025 reference (Astreka post) | Now (Feb 20, 2026; from CSV) |
|---|---|---|
| Price regime | ~4,000 after peak ~4,059 | ~5,089 |
| Support | 3,900–4,000 (dip buyers) | 4,855–4,900, then ~4,670 |
| Resistance | ~4,100+ (4,060–4,130 area) | 5,100–5,145, then ~5,600+ |
| RSI / momentum | “Overbought… RSI hovering at high levels” | RSI14 ~57.5 (not overbought) |
| Volatility | “Volatility… increased alongside gains” | ATR14 ~190 (still high) |
Oct-2025 references from Astreka’s October post: support/resistance and RSI/volatility commentary.
Scenarios and trade ideas
Bull case (higher highs resume): If growth continues to downshift while inflation stays sticky enough to keep policy uncertainty high, gold can reassert its “policy-risk hedge” bid. A clean breakout and hold above ~5,145 would open a path toward retesting the late-January blow-off zone. Catalysts: continued softening in growth data, renewed geopolitical risk, or markets leaning back into mid-year easing even with firm inflation prints.
Bear case (range breaks lower): If real rates reprice higher (because the “two-sided” Fed reaction function becomes the dominant narrative) and geopolitical risk fades, gold can unwind toward ~4,900 → ~4,670. A daily close back below the 20D SMA (~5,016) would be an early warning that momentum is rolling over, with the next “air pocket” down toward the February washout zone (early-month lows).
One-sentence takeaway
Gold’s week was a reminder that, at these price levels, the metal is trading less like a slow-moving store of value and more like a real-time referendum on policy credibility, growth risk, and geopolitical/tariff uncertainty.