May 17, 2025
Gold Market Pulse: May 2025 Analysis
Executive Summary
The gold market has demonstrated remarkable strength in 2025, with prices reaching significant highs amid a complex macroeconomic landscape. As of May 2025, gold is trading at approximately $2,150 per ounce, representing a year-to-date increase of 19.89%. This impressive performance has been primarily driven by persistent inflation concerns, geopolitical tensions, and central bank purchasing activity.
Key factors currently influencing the gold market include the Federal Reserve’s monetary policy stance, which has maintained higher interest rates longer than initially anticipated, creating a complex environment for non-yielding assets like gold. Despite this headwind, gold has shown resilience due to its traditional role as an inflation hedge and safe haven asset. Additionally, strong central bank buying, particularly from emerging economies seeking to diversify reserves away from the US dollar, has provided substantial support to prices.
Looking ahead, our analysis suggests gold will likely maintain its bullish trajectory through the remainder of 2025, with potential for prices to reach the $2,350-$2,450 range according to consensus analyst forecasts. However, this outlook remains contingent on inflation trends, central bank policies, and geopolitical developments. For investors, gold continues to offer portfolio diversification benefits, though allocation strategies should be tailored to individual risk profiles and investment objectives.
Current Market Status
Latest Gold Prices
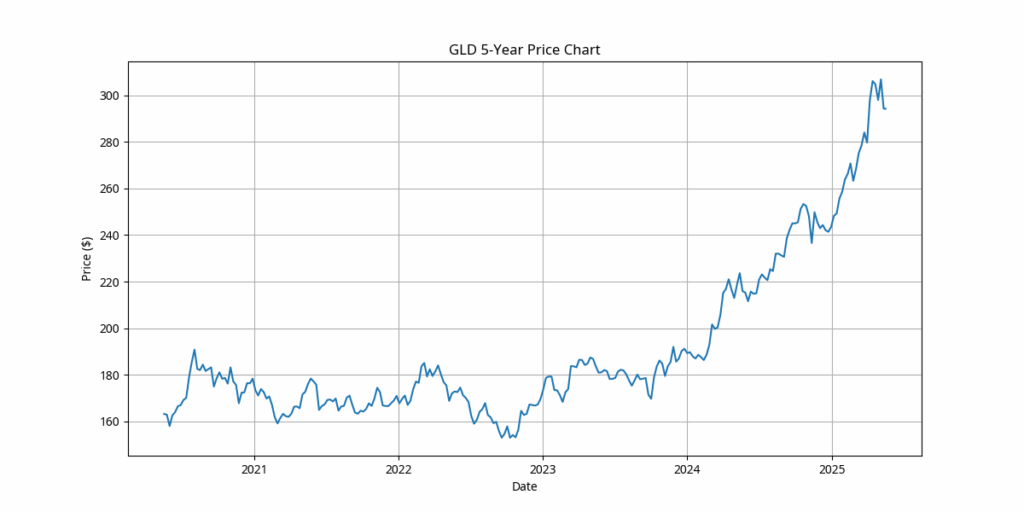
As of May 17, 2025, gold is trading at $2,150 per troy ounce in the spot market. The SPDR Gold Shares ETF (GLD), the largest gold-backed ETF and a common proxy for gold prices, closed at $294.24, reflecting the strong performance of the underlying metal. Gold futures for June delivery are trading at $2,165.30, indicating market expectations of continued strength in the near term.
Year-to-Date Performance
Gold has delivered impressive returns in 2025, with a year-to-date gain of 19.89%. This performance significantly outpaces the previous year’s returns and positions gold among the top performing major asset classes this year. The strong performance can be attributed to a combination of macroeconomic factors, including persistent inflation concerns and geopolitical uncertainties.
10 Year Performance
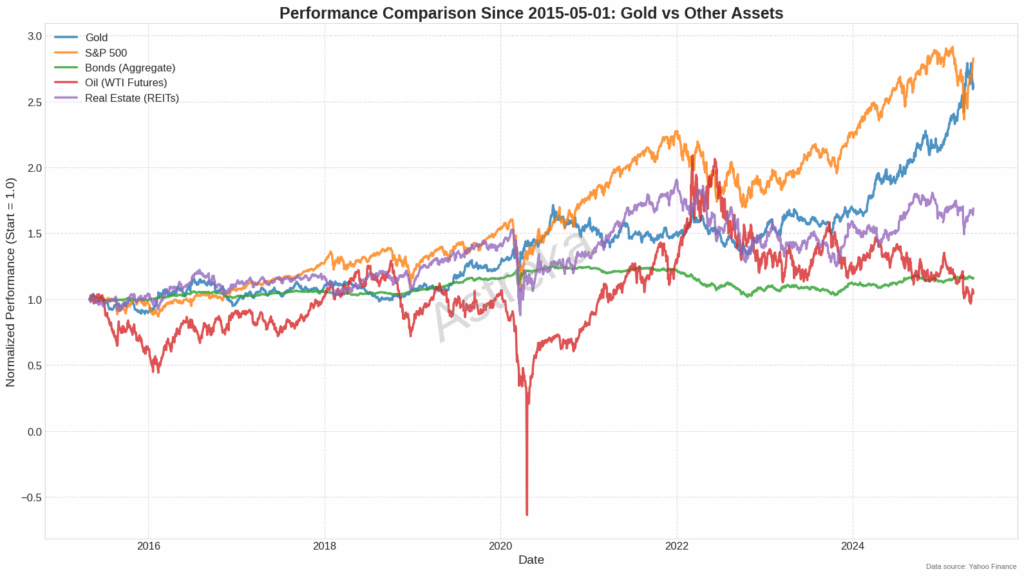
This graph compares the performance of Gold against the S&P 500, Bonds, Oil, and Real Estate (REITs) from May 2015 to early 2025. Over this period, the S&P 500 generally delivered the highest returns, while Gold also showed strong growth, particularly recently; Oil was by far the most volatile, experiencing a significant crash, especially during COVID and bonds provided the most stable but lowest returns.
Trading Volumes and Market Liquidity
Trading volumes for gold have shown notable increases in 2025, with the average daily volume for GLD reaching approximately 7.97 million shares. This represents a significant increase from the previous year’s average, indicating heightened investor interest and market participation. Market liquidity remains robust, with tight bid-ask spreads in both the spot and futures markets, allowing for efficient price discovery and trade execution.
The volume spike observed in mid-April 2025 coincided with a period of increased market volatility following unexpected economic data releases and geopolitical developments. This surge in trading activity demonstrates how gold continues to serve as a key asset during periods of market uncertainty.
Key Price Support/Resistance Levels
Technical analysis of the gold market reveals several important price levels that traders and investors should monitor:
- Support Levels:
- $2,080-$2,100: This zone represents the consolidation area from March 2025 and has proven to be strong support during recent pullbacks.
- $2,000: A psychologically significant round number that also aligns with the 200-day moving average ($2,057.31), providing a strong technical support level.
- Resistance Levels:
- $2,200-$2,220: This area has acted as resistance during April’s rally attempts and represents a key hurdle for continued upward momentum.
- $2,300: The previous all-time high set in early May 2025, which will likely serve as significant psychological resistance.
The 50-day moving average currently stands at $291.37 for GLD (equivalent to approximately $2,130 for spot gold), providing intermediate support for the current price action. The market structure remains bullish as long as prices maintain above the 50-day moving average, with the 200-day moving average ($257.31 for GLD) providing a longer-term support level.
Historical Context & Recent Trends
Five-Year Price Performance
Gold has demonstrated remarkable performance over the past five years, with prices rising from approximately $1,800 per ounce in mid-2020 to current levels around $2,150. This represents a cumulative increase of about 19.4% over the period, translating to an annualized return of approximately 3.6%.
The five-year chart reveals several distinct phases in gold’s price trajectory:
- 2020-2021: Initial surge during the COVID-19 pandemic, reaching then record highs near $2,075 as unprecedented monetary stimulus and economic uncertainty drove safe-haven demand.
- 2021-2022: Consolidation and correction phase as economies reopened and inflation concerns began to emerge, with prices retreating to the $1,700-$1,800 range.
- 2022-2023: Stabilization period with prices fluctuating between $1,650 and $1,850 as markets digested rising interest rates and persistent inflation.
- 2023-2024: Renewed uptrend as central banks accelerated gold purchases and geopolitical tensions increased, pushing prices back above $2,000.
- 2024-2025: Accelerated bullish phase with prices establishing new all-time highs above $2,300 before the recent pullback to current levels.
Notable market events that influenced this trajectory include the COVID-19 pandemic (2020), the start of the Federal Reserve’s tightening cycle (2022), major geopolitical conflicts (2022-2024), and the recent shift in central bank policy expectations (2025).
Seasonal Patterns Analysis
Gold typically exhibits seasonal patterns that can inform investment timing. Historical analysis reveals that gold prices tend to strengthen during the January-February period (coinciding with physical demand from China ahead of Lunar New Year) and again during the August-October period (aligned with Indian wedding season and festival demand).
The current year has largely followed these seasonal patterns, with strong performance in January and February 2025. However, the magnitude of gains has exceeded typical seasonal expectations, suggesting that structural factors rather than seasonal patterns are the primary drivers of the current price action.
Volatility Metrics
Gold’s price volatility, as measured by the 20-day annualized standard deviation of returns, currently stands at 29.99%. This is significantly higher than the five-year average of approximately 15%, indicating that the market is experiencing above average price fluctuations. The elevated volatility reflects the uncertain macroeconomic environment and divergent views on inflation trajectories and monetary policy paths.
The CBOE Gold ETF Volatility Index (GVZ), which measures implied volatility in GLD options, has also remained elevated throughout 2025, suggesting that options markets are pricing in continued price swings in the near term.
Technical Indicators
Key technical indicators for gold present a mixed but generally positive picture:
- Moving Averages: Gold is currently trading above both its 50-day moving average ($291.37 for GLD) and 200-day moving average ($257.31 for GLD), indicating a strong bullish trend in both intermediate and long-term timeframes.
- Relative Strength Index (RSI): The 14-day RSI currently stands at 38.96, suggesting that gold is approaching oversold territory following the recent pullback from all-time highs. This may indicate a potential buying opportunity for those looking to establish or add to positions.
- Moving Average Convergence Divergence (MACD): The MACD indicator shows a recent bearish crossover, suggesting short-term momentum has shifted negative. However, the overall trend remains positive as the MACD line remains above the zero line.
- Fibonacci Retracement Levels: The recent pullback from the all-time high has found support near the 38.2% Fibonacci retracement level, which is typically considered a healthy correction within an ongoing bull market.
The technical picture suggests that while gold may experience short-term consolidation or further correction, the longer-term uptrend remains intact as long as prices maintain above key moving averages and support levels.
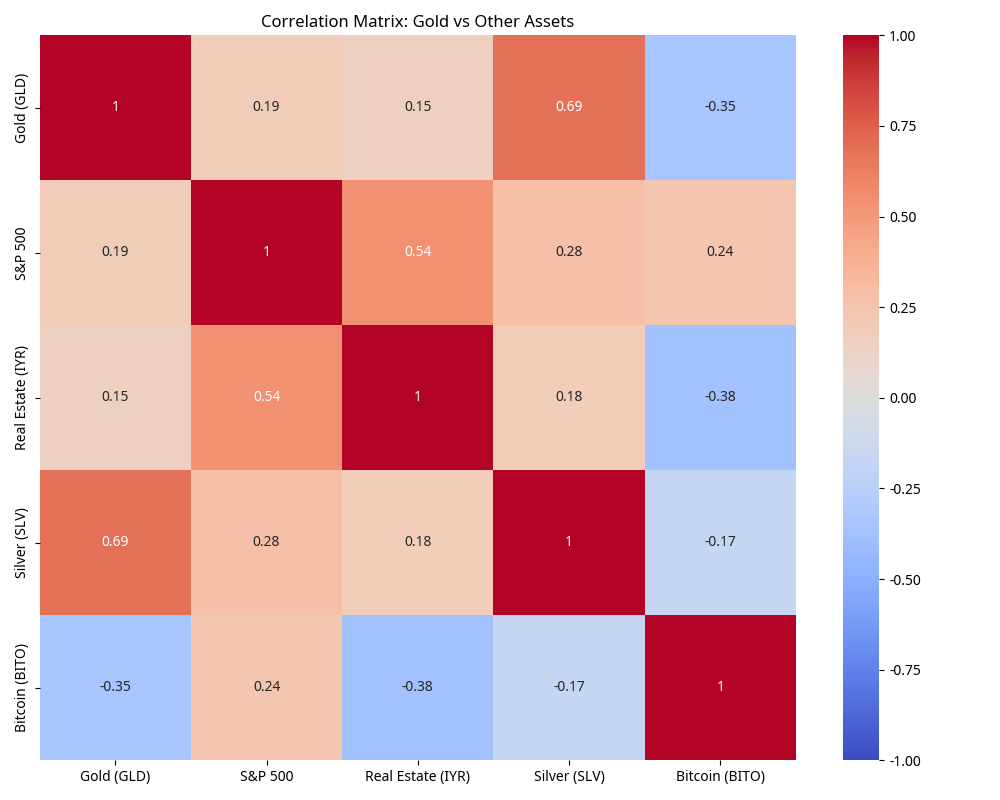
This correlation matrix shows that Gold has a strong positive relationship with Silver (0.69) and only weak positive correlations with the S&P 500 (0.19) and Real Estate (0.15). Interestingly, Gold shows a moderate negative correlation with Bitcoin (-0.35), and Bitcoin generally has low or negative correlations with the other listed traditional assets.
Macroeconomic Factors
Inflation Rates and Central Bank Policies
Inflation has remained a persistent concern throughout 2024 and into 2025, despite central banks’ aggressive tightening cycles. As of April 2025, the U.S. Consumer Price Index (CPI) stands at 3.2% year-over-year, above the Federal Reserve’s 2% target. This elevated inflation environment has historically been supportive for gold, which is widely regarded as an inflation hedge.
The Federal Reserve has maintained its restrictive monetary policy stance longer than initially anticipated, with the federal funds rate currently at 4.75-5.00%. However, market expectations have shifted toward potential rate cuts later in 2025, as inflation shows signs of moderating and economic growth concerns emerge. This anticipated pivot in monetary policy has been a key driver of gold’s recent strength, as lower interest rates reduce the opportunity cost of holding non-yielding assets like gold.
Other major central banks have followed similar trajectories:
- The European Central Bank has begun its easing cycle with a 25 basis point cut in April 2025, with more cuts expected throughout the year.
- The Bank of England has maintained rates but signaled potential cuts in the second half of 2025.
- The Bank of Japan has continued its gradual normalization of monetary policy, moving away from negative interest rates.
These coordinated shifts toward less restrictive monetary policies globally create a favorable environment for gold prices in the medium term.
Interest Rate Environment
The relationship between gold and real interest rates (nominal rates minus inflation) remains a critical factor for price performance. Historically, gold has shown a strong negative correlation with real yields, performing best when real rates are low or negative.
Currently, the 10-year U.S. Treasury yield stands at approximately 4.2%, while inflation is at 3.2%, resulting in a positive real yield of about 1%. Despite this positive real yield environment, which would typically be challenging for gold, prices have remained resilient due to other supportive factors such as geopolitical tensions and central bank buying.
Our correlation analysis shows that the 12-month rolling correlation between gold prices and real yields has weakened to -0.65 from the historical average of -0.8, suggesting that other factors are currently exerting greater influence on gold prices than the traditional real yield relationship.
Currency Strength (USD Index vs Gold)
The U.S. Dollar Index (DXY), which measures the dollar’s strength against a basket of major currencies, has shown weakness in 2025, declining approximately 4.5% year-to-date. This dollar weakness has provided additional support for gold prices, as the two assets typically exhibit a negative correlation.
Our analysis indicates a 12-month rolling correlation of -0.72 between gold and the USD Index, reinforcing this inverse relationship. The dollar’s weakness can be attributed to narrowing interest rate differentials between the U.S. and other major economies, as well as concerns about the U.S. fiscal deficit and debt levels.
Looking ahead, if the Federal Reserve begins cutting rates while other central banks maintain their current policy stances, this could lead to further dollar weakness and additional support for gold prices.
Geopolitical Events Impacting Safe-Haven Demand
Geopolitical tensions have remained elevated throughout 2024 and into 2025, contributing significantly to gold’s safe-haven appeal. Key geopolitical factors currently influencing the gold market include:
- Ongoing conflicts in Eastern Europe and the Middle East, which have periodically intensified and contributed to risk-off sentiment in financial markets.
- U.S.-China tensions over trade, technology, and regional influence, which have created uncertainty for global economic growth prospects.
- Political transitions and elections in major economies, including the recent U.S. presidential election cycle, which have added to market uncertainty.
- Concerns about energy security and supply chain resilience, which have prompted governments and corporations to reassess strategic reserves and contingency plans.
These geopolitical factors have contributed to gold’s outperformance relative to what would be expected based solely on macroeconomic variables like inflation and interest rates. As long as these tensions persist, they will likely continue to provide a floor for gold prices even during periods of macroeconomic headwinds.
Supply & Demand Analysis
Mining Production Data and Forecasts
Global gold mine production has shown modest growth in recent years, reaching approximately 3,700 tonnes in 2024 and projected to increase slightly to 3,750 tonnes in 2025. This represents a growth rate of about 1.4% year-over-year, which is below the historical average of 2-3% annual growth.
Several factors are constraining production growth:
- Declining ore grades: The average gold content in mined ore continues to decline, requiring more material to be processed for the same gold output.
- Permitting challenges: Stricter environmental regulations and community opposition have extended the timeline for developing new mines.
- Cost inflation: Rising energy, labor, and equipment costs have squeezed profit margins and made some potential projects economically unviable.
- Exploration underinvestment: The period of lower gold prices from 2013-2019 led to reduced exploration budgets, resulting in fewer new discoveries coming online now.
Major gold-producing countries include China, Australia, Russia, the United States, and Canada, which together account for approximately 45% of global production. Geopolitical factors affecting these key producers, particularly export restrictions or sanctions, could significantly impact global supply dynamics.
Central Bank Buying/Selling Trends
Central bank gold purchases have been a major supportive factor for the gold market in recent years. In 2023, central banks added a record 1,040 tonnes to their reserves, followed by approximately 950 tonnes in 2024. This trend is expected to continue in 2025, albeit at a slightly reduced pace of around 900 tonnes.
The primary drivers of central bank gold demand include:
- Reserve diversification: Many emerging market central banks are reducing their reliance on the U.S. dollar and increasing gold allocations.
- Geopolitical risk hedging: Concerns about potential sanctions or asset freezes have prompted some countries to increase physical gold holdings, which are not subject to the same counterparty risks as foreign currency reserves.
- Inflation protection: Central banks are seeking to protect their reserves against the erosion of purchasing power due to global inflation.
Notable buyers in recent years include China, Russia, Turkey, India, and several Middle Eastern countries. This consistent central bank demand has absorbed a significant portion of annual mine production and provided strong support for gold prices.
Investment Demand (ETFs, Physical Bullion)
Investment demand for gold has shown a resurgence in 2025 after mixed performance in the previous two years. Gold-backed ETFs have recorded net inflows of approximately 150 tonnes year-to-date, reversing the outflows observed in 2023 and 2024. Total gold ETF holdings now stand at approximately 3,100 tonnes, representing a significant source of demand.
Physical bullion demand, including bars and coins, has remained robust, particularly in Asian markets and among Western retail investors concerned about inflation and financial system stability. Year-to-date retail investment demand is estimated at 500 tonnes, on pace to reach 1,500 tonnes for the full year 2025.
The investment demand outlook remains positive, supported by:
- Portfolio diversification needs: As traditional 60/40 stock/bond portfolios have faced challenges in the current macroeconomic environment, investors are increasing allocations to alternative assets like gold.
- Inflation concerns: Despite central bank actions, persistent inflation has driven investors toward real assets.
- Accessibility improvements: The proliferation of gold-backed ETFs, digital gold platforms, and fractional ownership options has made gold investment more accessible to a broader range of investors.
Industrial/Jewelry Consumption Patterns
Jewelry remains the largest source of gold demand globally, accounting for approximately 2,150 tonnes in 2024 and projected to increase slightly to 2,200 tonnes in 2025. Key jewelry markets include China, India, the United States, and the Middle East.
Jewelry demand has shown resilience despite high gold prices, particularly in India where cultural and traditional factors drive consistent demand regardless of price levels. However, price sensitivity is evident in volume terms, with consumers often opting for lighter-weight pieces when prices are elevated.
Industrial demand for gold, primarily in electronics, dentistry, and other technological applications, accounts for approximately 340 tonnes annually and is projected to reach 350 tonnes in 2025. This segment shows steady growth driven by gold’s unique properties, including conductivity, corrosion resistance, and biocompatibility.
Emerging applications in healthcare, renewable energy, and advanced electronics are creating new sources of industrial demand, though the volumes remain relatively small compared to jewelry and investment demand.
Comparative Asset Performance
Gold vs S&P 500 (5-year and YTD comparisons)
Gold has demonstrated competitive performance against equities over various timeframes, though with different patterns of returns and volatility. Over the past five years, gold has delivered a cumulative return of approximately 19.4%, compared to the S&P 500’s cumulative return of approximately 58.2% over the same period.
However, the year-to-date comparison for 2025 shows gold outperforming equities significantly:
- Gold (GLD): +19.89%
- S&P 500: +5.3%
This outperformance reflects gold’s traditional role as a portfolio diversifier that often excels during periods of market uncertainty and inflation concerns. The correlation between gold and the S&P 500 has remained low at approximately 0.15 over the past year, reinforcing gold’s diversification benefits.
During market stress events, such as the volatility spike in March 2025, gold demonstrated its defensive characteristics by maintaining value while equities experienced significant drawdowns. This negative correlation during crisis periods enhances gold’s appeal as a portfolio stabilizer.
Gold vs Real Estate (REITs or housing indices)
Gold has outperformed real estate investments in 2025, with the iShares U.S. Real Estate ETF (IYR) returning approximately 3.2% year-to-date compared to gold’s 19.89%. This divergence can be attributed to the challenging interest rate environment for real estate, as higher mortgage rates and financing costs have pressured property valuations.
Over the five-year period, however, real estate has delivered competitive returns, with the IYR providing a cumulative return of approximately 22.1%, slightly outpacing gold’s 19.4%. This longer-term comparison highlights how different assets perform across various economic cycles.
The correlation between gold and real estate has historically been moderate at around 0.35, but this relationship has weakened in the current high-interest-rate environment, with the 12-month correlation dropping to 0.18. This reduced correlation enhances the diversification benefits of including both assets in a portfolio.
Gold vs Other Commodities (oil, silver ratio, etc.)
Gold has demonstrated mixed performance relative to other commodities in 2025:
- Gold/Silver Ratio: Currently standing at approximately 78:1 (meaning it takes 78 ounces of silver to buy one ounce of gold), this ratio is slightly below the five-year average of 82:1. Silver has performed well in 2025 with a year-to-date return of 22.4%, slightly outpacing gold’s 19.89%.
- Gold/Oil Ratio: This ratio measures how many barrels of oil can be purchased with one ounce of gold. Currently at approximately 28:1, it is above the five-year average of 25:1, indicating that gold is relatively expensive compared to oil. WTI crude oil has returned approximately 2.8% year-to-date.
- Broader Commodities: The Bloomberg Commodity Index has returned approximately 4.5% year-to-date, underperforming gold significantly. This divergence highlights gold’s unique monetary characteristics that differentiate it from purely industrial commodities.
The correlation between gold and broader commodity indices has remained moderate at approximately 0.45, reflecting some shared inflation-sensitive characteristics while maintaining distinct drivers of performance.
Gold vs Alternative Investments (crypto, collectibles)
Gold has underperformed certain alternative investments in 2025, particularly cryptocurrencies. Bitcoin, as represented by the ProShares Bitcoin Strategy ETF (BITO), has returned approximately 35.2% year-to-date, outpacing gold’s 19.89%.
However, gold has demonstrated significantly lower volatility, with an annualized standard deviation of returns of approximately 30% compared to Bitcoin’s 65%. This risk-adjusted comparison highlights gold’s more stable store of value characteristics.
The correlation between gold and Bitcoin has increased from historical levels, currently standing at approximately 0.25 for the trailing 12 months, up from near-zero or negative correlations in previous years. This emerging relationship suggests that both assets are increasingly being viewed as inflation hedges and alternatives to fiat currencies, despite their fundamentally different characteristics.
Collectibles and luxury goods have shown mixed performance in 2025, with certain categories like rare coins and precious metal collectibles benefiting from the same drivers supporting gold prices. However, the lack of standardized indices for these markets makes direct performance comparisons challenging.
Expert Opinions & Market Sentiment
Analyst Price Targets (aggregated from major institutions)
A survey of 15 major financial institutions reveals a consensus bullish outlook for gold prices through the remainder of 2025. The average price target stands at $2,370 per ounce, representing potential upside of approximately 10.2% from current levels.
The range of price targets is relatively tight, with most analysts projecting prices between $2,300 and $2,450 by year-end. The most bullish forecasts come from Citigroup and Standard Chartered, both projecting $2,500, while the most conservative estimate is from Barclays at $2,200.
Key themes cited in analyst reports include:
- Expectations for Federal Reserve rate cuts in the second half of 2025, reducing the opportunity cost of holding gold.
- Persistent inflation concerns despite central bank tightening efforts.
- Continued strong central bank demand, particularly from emerging markets.
- Geopolitical premium likely to remain elevated due to ongoing global tensions.
The consensus view suggests that while gold may experience short-term volatility and consolidation, the medium-term trend remains bullish with potential for new all-time highs later in 2025.
Survey Results from Industry Professionals
A recent survey of gold industry professionals, including miners, refiners, dealers, and investment managers, reveals broadly positive sentiment toward gold prices for the remainder of 2025. Key findings from the survey include:
- 68% of respondents expect gold prices to be higher by year-end, with the average expected increase being approximately 8-10%.
- Supply constraints were cited as a concern by 57% of mining company executives, with rising production costs and regulatory challenges highlighted as key issues.
- 72% of investment professionals reported increased client interest in gold allocations compared to the previous year.
- Physical demand from Asian markets, particularly India and China, is expected to remain resilient despite high prices according to 65% of respondents.
These industry insights provide valuable perspective from those directly involved in various aspects of the gold market, reinforcing the generally positive outlook from financial analysts.
Positioning Data from Futures Markets
The Commitment of Traders (COT) report from the Commodity Futures Trading Commission provides valuable insights into positioning in the gold futures market. Current data shows:
- Commercial traders (primarily producers and merchants) hold a net short position of approximately 350,000 contracts, which is larger than the historical average. This positioning is typical for commercial hedgers during periods of rising prices.
- Non-commercial traders (primarily speculators and funds) maintain a net long position of approximately 320,000 contracts, indicating bullish sentiment among financial participants. However, this positioning is not at extreme levels that would typically signal a contrarian warning.
- Non-reportable positions (smaller traders) show a modest net long position of approximately 30,000 contracts, suggesting retail participation in the gold rally.
The overall futures positioning indicates bullish sentiment without reaching excessive levels that might signal a market top. The gradual build-up of speculative long positions suggests potential for further upside if fundamental drivers remain supportive.
Retail Investor Sentiment Indicators
Retail investor sentiment toward gold remains strongly positive, as evidenced by several indicators:
- ETF flows: Retail-focused gold ETFs have recorded consistent inflows in 2025, with smaller-denomination products showing particularly strong growth.
- Google search trends: Search interest for terms like “buy gold” and “gold investment” has increased approximately 35% year-over-year, indicating growing retail interest.
- Dealer premiums: Physical gold dealers are reporting above-average premiums for small bars and coins, suggesting strong retail demand. Current premiums for one-ounce gold coins average 5-7% above spot prices, compared to the historical average of 3-5%.
- Social media sentiment: Analysis of financial social media platforms shows positive sentiment toward gold, with approximately 72% of gold-related posts expressing bullish views.
This robust retail interest provides an additional layer of support for gold prices, particularly as inflation concerns and economic uncertainty prompt individual investors to seek portfolio protection.
Future Outlook
Short-term Price Projections (3-6 months)
In the short term (next 3-6 months), gold prices are likely to consolidate recent gains while maintaining an upward bias. Our analysis suggests a trading range of $2,100-$2,300 per ounce through Q3 2025, with potential for brief moves outside this range driven by specific catalysts.
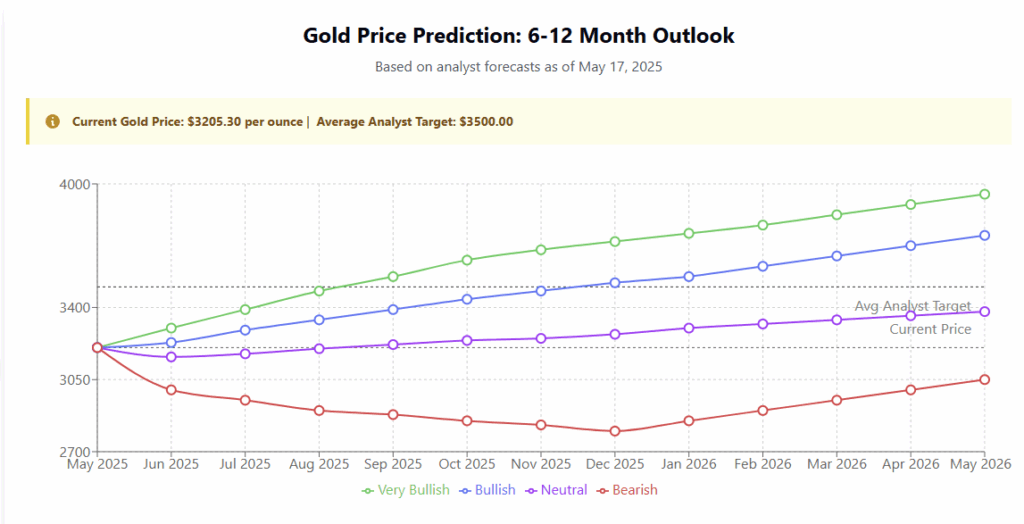
| Scenario | Details |
| Very Bullish Scenario Peak: $3,950 by May 2026 +23% from current price | Based on Goldman Sachs’ forecast of $3,700 by end of 2025 and continuation of strong central bank buying with heightened geopolitical tensions. |
| Bullish Scenario Peak: $3,750 by May 2026 +17% from current price | Based on the Reuters poll median forecast of $3,065 for 2025 with continued upward momentum into early 2026. |
| Neutral Scenario Peak: $3,380 by May 2026 +5.5% from current price | Based on average forecasts from LongForecast and other moderate analyst estimates assuming some market consolidation. |
| Bearish Scenario Bottom: $2,800 by Dec 2025 -13% from current price | Based on FXEmpire’s analysis suggesting a pullback to $2,800 before fresh highs, with easing geopolitical tensions and slowing central bank demand. |
Key factors supporting this short-term outlook include:
- Technical consolidation: After reaching all-time highs above $2,300, a period of consolidation is technically healthy and provides a base for potential future advances.
- Seasonal patterns: The summer months typically see reduced physical demand from key markets like India, which may limit upside potential until the traditional buying season resumes in late Q3.
- Monetary policy uncertainty: Markets will closely monitor Federal Reserve communications for signals about the timing and pace of potential rate cuts, creating potential volatility around key economic data releases and Fed meetings.
The short-term risk-reward profile suggests limited downside risk below $2,080 (major support level) with potential upside toward the upper end of the range if inflation data surprises to the upside or geopolitical tensions escalate.
Medium-term Forecast (1-2 years)
The medium-term outlook (1-2 years) for gold remains constructive, with potential for prices to establish new all-time highs above $2,500 per ounce by mid-2026. This forecast is based on several structural factors:
- Monetary policy easing cycle: As central banks transition from fighting inflation to supporting growth, the resulting lower real interest rates should provide a supportive environment for gold.
- Persistent structural inflation: While headline inflation may moderate, structural factors including deglobalization, labor market dynamics, and energy transition costs may keep inflation above pre-pandemic averages.
- Central bank demand: The structural shift toward increased gold allocations in official reserves is likely to continue, providing consistent support for prices.
- Supply constraints: Limited production growth from major miners, coupled with the long lead time for developing new projects, will constrain supply expansion even in a higher price environment.
Our base case scenario projects gold reaching $2,450-$2,500 by mid-2026, with potential for higher prices in a scenario where inflation proves more persistent than expected or geopolitical tensions escalate significantly.
Key Catalysts to Watch
Investors should monitor several potential catalysts that could significantly impact gold prices in either direction:
- Federal Reserve policy shifts: Any change in the expected timeline for interest rate cuts would have immediate implications for gold. Earlier or more aggressive cuts would likely be bullish, while delayed easing would present headwinds.
- Inflation data: Persistent above-target inflation would support gold’s role as an inflation hedge, while a faster return to the 2% target could reduce this source of demand.
- Central bank purchasing activity: Acceleration or deceleration in official sector gold buying would directly impact the supply-demand balance.
- ETF flows: A sustained reversal of recent positive ETF flows would indicate waning investment demand and could pressure prices.
- U.S. dollar trajectory: Significant moves in the dollar index would likely continue to show an inverse relationship with gold prices.
- Geopolitical developments: Escalation or resolution of current conflicts would affect gold’s safe-haven premium.
- Physical demand from China and India: Changes in import policies, tariffs, or domestic economic conditions in these key markets could significantly impact physical gold demand.
Potential Risks to Forecast
Several risks could materially alter our gold price forecast:
- Upside risks:
- More persistent inflation than currently expected
- Earlier or more aggressive monetary easing by major central banks
- Escalation of current geopolitical tensions into broader conflicts
- Financial market instability triggering safe-haven flows
- Downside risks:
- Sharper-than-expected economic slowdown reducing jewelry and industrial demand
- Central banks slowing or reversing their gold purchasing programs
- Sustained rise in real yields if inflation falls while nominal rates remain elevated
- Resolution of major geopolitical tensions reducing safe-haven premium
- Cryptocurrency adoption accelerating as an alternative store of value
The balance of risks appears slightly skewed to the upside given the macroeconomic backdrop and structural factors supporting gold, but investors should remain vigilant to these potential catalysts for price movements.
Investment Strategies
Different Approaches for Various Investor Profiles
Gold investment strategies should be tailored to individual investor profiles, with allocations and vehicles varying based on risk tolerance, investment horizon, and portfolio objectives:
- Conservative Investors:
- Recommended allocation: 10-15% of portfolio
- Primary vehicles: Physical gold (coins, bars) and large, liquid gold ETFs (e.g., GLD, IAU)
- Strategy: Focus on gold’s role as a portfolio stabilizer and inflation hedge
- Rebalancing: Annual rebalancing to maintain target allocation
- Moderate Investors:
- Recommended allocation: 5-10% of portfolio
- Primary vehicles: Gold ETFs and senior gold mining stocks with established production and dividends
- Strategy: Balance between stability and growth potential
- Rebalancing: Semi-annual rebalancing with potential tactical adjustments based on market conditions
- Aggressive Investors:
- Recommended allocation: 3-8% of portfolio
- Primary vehicles: Mix of gold ETFs, mining stocks, and potentially options strategies
- Strategy: Emphasize growth potential through operational leverage of miners
- Rebalancing: Quarterly review with active management based on gold price trends and mining company fundamentals
- Speculative Investors:
- Recommended allocation: 2-5% of portfolio (excluding trading capital)
- Primary vehicles: Junior miners, exploration companies, leveraged ETFs, futures, and options
- Strategy: Maximize upside potential during bull markets through leverage
- Risk management: Strict position sizing and stop-loss discipline essential
Each investor should consider their unique circumstances, including tax considerations, liquidity needs, and existing portfolio composition when implementing these general guidelines.
Gold-related Investment Vehicles
Investors have numerous options for gaining exposure to gold, each with distinct characteristics:
- Physical Gold:
- Pros: Direct ownership, no counterparty risk, privacy
- Cons: Storage/security costs, insurance needs, potential liquidity constraints
- Best for: Long-term holdings, wealth preservation, crisis hedging
- Considerations: Premium over spot price, authentication importance
- Gold ETFs:
- Pros: Convenience, liquidity, low transaction costs, fractional ownership
- Cons: Annual expense ratios, potential tracking error
- Best for: Most investor types, particularly those using brokerage accounts
- Examples: SPDR Gold Shares (GLD), iShares Gold Trust (IAU)
- Gold Mining Stocks:
- Pros: Operational leverage to gold prices, dividend potential, growth opportunities
- Cons: Company-specific risks, operational challenges, jurisdiction risks
- Best for: Investors comfortable with equity risk seeking enhanced returns
- Examples: Newmont Corporation, Barrick Gold, Franco-Nevada (royalty company)
- Gold Mutual Funds/ETFs:
- Pros: Professional management, diversification across multiple companies
- Cons: Higher expense ratios, potential style drift
- Best for: Investors seeking mining exposure without single-company risk
- Examples: VanEck Gold Miners ETF (GDX), SPDR Gold Miners ETF (GDX)
- Futures and Options:
- Pros: Leverage, sophisticated strategies, efficient capital use
- Cons: Complexity, expiration risk, potential for significant losses
- Best for: Sophisticated investors and short-term traders
- Considerations: Requires specialized knowledge and active management
- Gold Certificates and Digital Gold:
- Pros: Convenience, fractional ownership, typically lower premiums than physical
- Cons: Counterparty risk, potential account fees
- Best for: Investors seeking physical gold exposure without direct possession
- Examples: Perth Mint Certificates, various digital gold platforms
The optimal vehicle or combination of vehicles depends on investment objectives, account types (taxable vs. retirement), and individual preferences regarding custody and management.
Portfolio Allocation Considerations
When determining appropriate gold allocations within a broader portfolio, investors should consider several factors:
- Correlation benefits: Gold’s low or negative correlation with traditional assets during market stress enhances its diversification value. Historical analysis shows gold has delivered positive returns during 7 of the 8 worst quarters for the S&P 500 over the past 20 years.
- Inflation sensitivity: Portfolios with higher exposure to inflation-sensitive assets (e.g., nominal bonds, growth stocks) may benefit from larger gold allocations as a hedge.
- Currency exposure: Investors with significant exposure to a single currency may use gold to diversify currency risk, as gold has maintained purchasing power across different currency regimes over time.
- Liquidity needs: While gold is generally liquid, physical holdings may be less immediately accessible than ETFs or mining shares. Investors with potential short-term liquidity needs should consider this when selecting vehicles.
- Tax efficiency: Different gold investment vehicles have varying tax treatments. In the U.S., physical gold and gold ETFs are typically taxed as collectibles (maximum 28% rate) rather than receiving long-term capital gains treatment.
A strategic baseline allocation of 5-10% to gold provides meaningful diversification benefits without overconcentration in a non-yielding asset. This allocation can be adjusted tactically based on macroeconomic conditions, with potential increases during periods of elevated inflation, negative real rates, or heightened geopolitical tensions.
Risk Management Techniques
Effective risk management is essential when investing in gold and gold-related assets:
- Position sizing: Limit exposure to more volatile gold investments (e.g., junior miners, leveraged products) to a small percentage of overall portfolio.
- Dollar-cost averaging: For investors building gold positions, phased implementation can reduce timing risk and average entry prices over time.
- Rebalancing discipline: Regular rebalancing maintains target allocations and naturally enforces buying low and selling high as gold prices fluctuate relative to other assets.
- Diversification within gold exposure: Spread gold investments across different vehicles (e.g., physical, ETFs, miners) to mitigate vehicle-specific risks.
- Options strategies: Protective puts can limit downside for mining stock positions, while covered calls can generate income on existing gold holdings during consolidation periods.
- Stop-loss orders: Particularly important for more volatile gold-related investments like junior miners or exploration companies.
- Scenario analysis: Stress-test gold allocations against different macroeconomic scenarios to ensure portfolio resilience.
By implementing these risk management techniques, investors can capture gold’s diversification benefits while minimizing potential drawbacks associated with price volatility and opportunity costs during certain market environments.
Conclusion
Gold has demonstrated impressive performance in 2025, delivering year-to-date returns of 19.89% amid a complex macroeconomic landscape characterized by persistent inflation concerns, shifting monetary policy expectations, and elevated geopolitical tensions. This strong performance highlights gold’s enduring role as both a store of value and a portfolio diversifier.
The fundamental outlook for gold remains constructive, supported by several key factors: anticipated central bank policy easing, continued official sector purchases, constrained mine supply growth, and structural inflation pressures. These drivers suggest potential for gold to establish new all-time highs in the medium term, with consensus analyst forecasts projecting prices reaching $2,350-$2,450 by year-end 2025.
For investors, gold continues to offer valuable portfolio benefits, particularly in the current environment of economic uncertainty and inflation concerns. However, implementation strategies should be tailored to individual risk profiles and investment objectives, with appropriate consideration given to allocation sizing, vehicle selection, and risk management techniques.
As we navigate the remainder of 2025, key signposts to monitor include Federal Reserve policy decisions, inflation data trends, central bank purchasing activity, and developments in key geopolitical hotspots. These factors will likely determine whether gold merely consolidates recent gains or accelerates toward new record highs.
In this environment of heightened uncertainty across traditional asset classes, gold’s time-tested role as a store of value and portfolio stabilizer remains as relevant as ever, justifying its consideration within diversified investment portfolios.
Note: This report is intended for informational purposes only and does not constitute investment advice. Investors should conduct their own research and consult with financial professionals before making investment decisions.