May 17, 2026
Best EMA for Futures Trading: 5-Minute NQ EMA Backtest
Which EMA Length Performs Best in Futures?
Why This Matters
Traders constantly debate whether fast or slow EMAs work better for futures markets.
The problem is that most EMA discussions are based on screenshots, personal preference, or one good-looking chart. That makes it hard to know whether a popular exponential moving average futures trading setup actually has an edge, or whether it just fits a recent move.
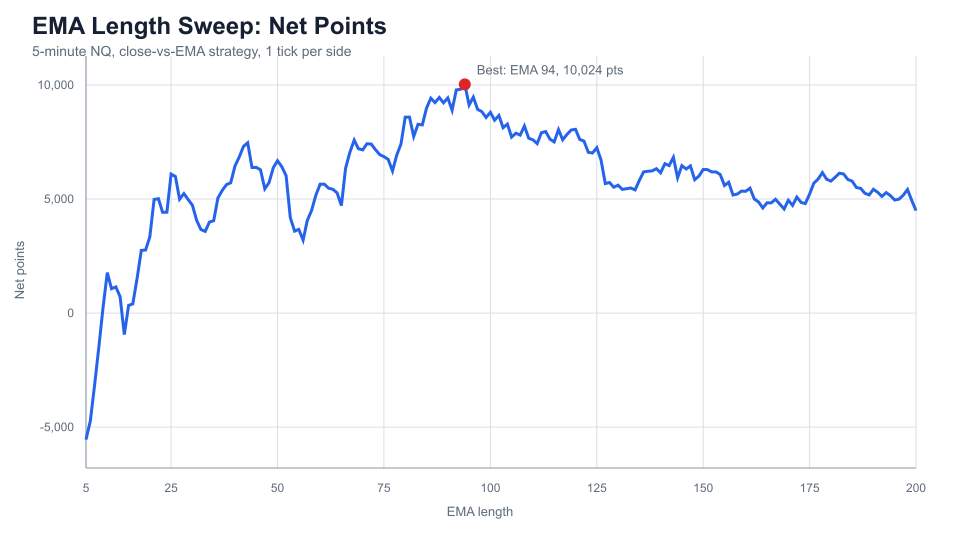
So I tested every EMA length from **5 to 200** on 5-minute NQ futures data using the same close-vs-EMA rules and the same cost assumptions. The goal was simple: find the best EMA for futures trading in this specific dataset, then look at whether the result was stable enough to be useful.
The best-performing EMA length in this test was the **94-period EMA**.
Using 5-minute NQ futures data from **March 20, 2025 through May 15, 2026**, a simple close-vs-EMA strategy produced the strongest net result with EMA 94: **10,024.3 points**, or about **$200,486** per one NQ contract before broker commissions and fees beyond the cost model used here.
That does not mean EMA 94 is a magic number. The more useful takeaway is that, on this dataset and with this 5 minute EMA strategy, the best results clustered around the **high-80s to mid-90s**. Shorter EMAs were generally more reactive, but they also got chopped up by more frequent flips.
Test Setup
This used NQ continuous futures data`, which contains 5-minute OHLCVD bars for `NQM26-CME`.
– Market: NQ futures
– Bar size: 5 minutes
– Test period: March 20, 2025, 16:15 through May 15, 2026, 15:15
– Rows tested: 81,546 bars
– EMA lengths tested: 5 through 200
– Contract assumption: 1 NQ contract
– NQ point value: $20 per point
– Cost assumption: 1 tick per side, equal to 0.25 points or $5 per side
The strategy was intentionally simple:
1. Calculate the EMA from closing prices.
2. If the close is above the EMA, the strategy wants to be long.
3. If the close is below the EMA, the strategy wants to be short.
4. The signal from one completed bar is executed at the next bar open.
5. The strategy is always in the market after the EMA warmup period.
That next-bar execution matters. It avoids using a bar’s close to enter at the same close, which would make the test look cleaner than it would have been in real time.
This is not meant to be a fully optimized EMA strategy futures system. It is a controlled comparison of EMA settings for futures, using one consistent rule so the EMA length is the main variable being tested.
Top EMA Lengths by Net P&L
| Rank | EMA Length | Net Points | Est. Net $ | Trades | Win Rate | Profit Factor | Max Drawdown |
|---|---|---|---|---|---|---|---|
| 1 | 94 | 10,024.3 | $200,486 | 4,477 | 17.7% | 1.15 | 2,637.9 pts |
| 2 | 93 | 9,809.0 | $196,180 | 4,515 | 17.9% | 1.15 | 2,683.5 pts |
| 3 | 92 | 9,782.0 | $195,640 | 4,553 | 17.8% | 1.15 | 2,861.6 pts |
| 4 | 96 | 9,468.4 | $189,368 | 4,447 | 17.6% | 1.14 | 2,722.9 pts |
| 5 | 88 | 9,449.0 | $188,980 | 4,643 | 18.0% | 1.14 | 2,802.5 pts |
| 6 | 90 | 9,433.6 | $188,672 | 4,581 | 17.9% | 1.14 | 2,884.0 pts |
| 7 | 86 | 9,417.9 | $188,358 | 4,687 | 18.2% | 1.14 | 2,993.9 pts |
| 8 | 87 | 9,225.7 | $184,514 | 4,673 | 18.0% | 1.13 | 2,923.3 pts |
| 9 | 89 | 9,219.2 | $184,384 | 4,621 | 17.7% | 1.14 | 2,902.0 pts |
| 10 | 95 | 9,120.1 | $182,402 | 4,469 | 17.5% | 1.14 | 2,872.5 pts |
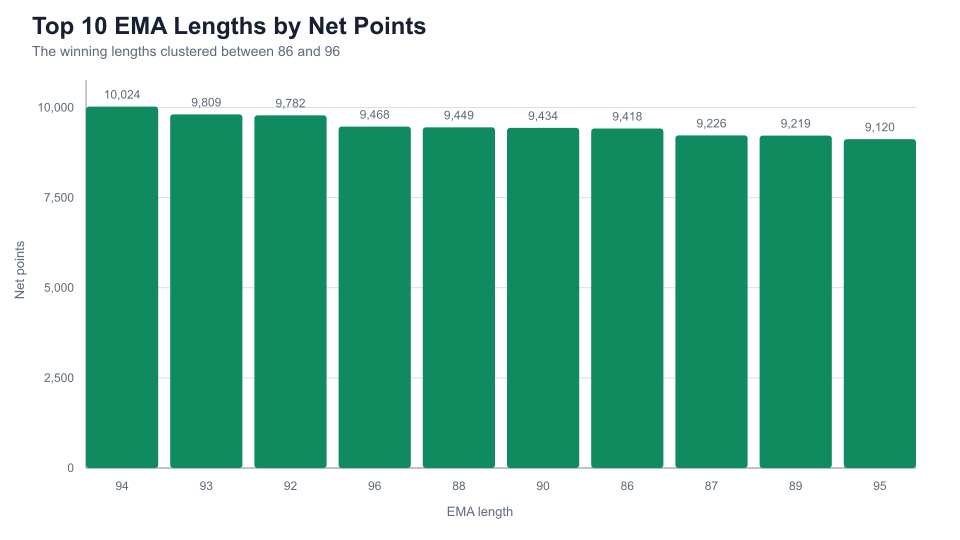
The top 10 were tightly grouped. Every top result came from EMA lengths between **86 and 96**, which is more important than the exact winning value of 94.
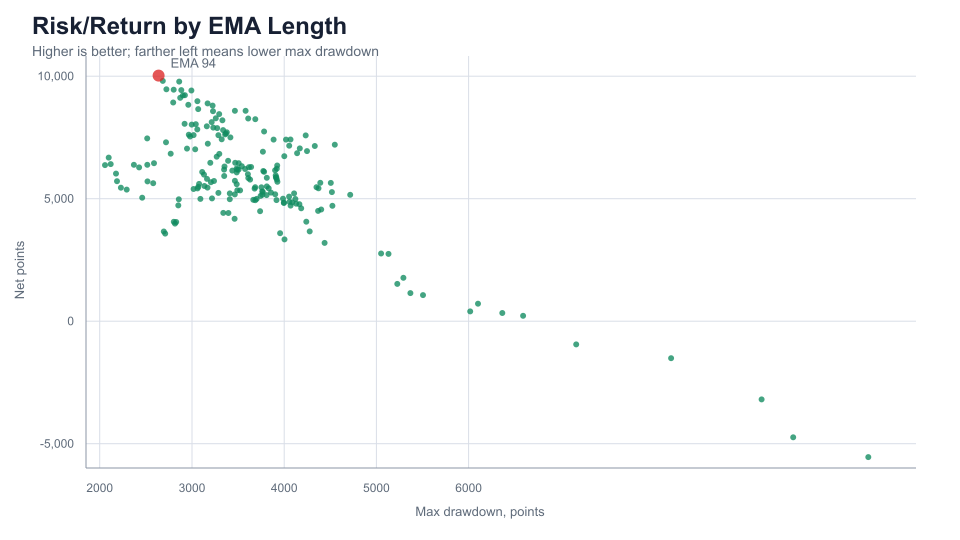
EMA 94 also had the best return-to-drawdown ratio in the sweep, at **3.80**, and the best average trade, at **2.24 points per trade** after costs.
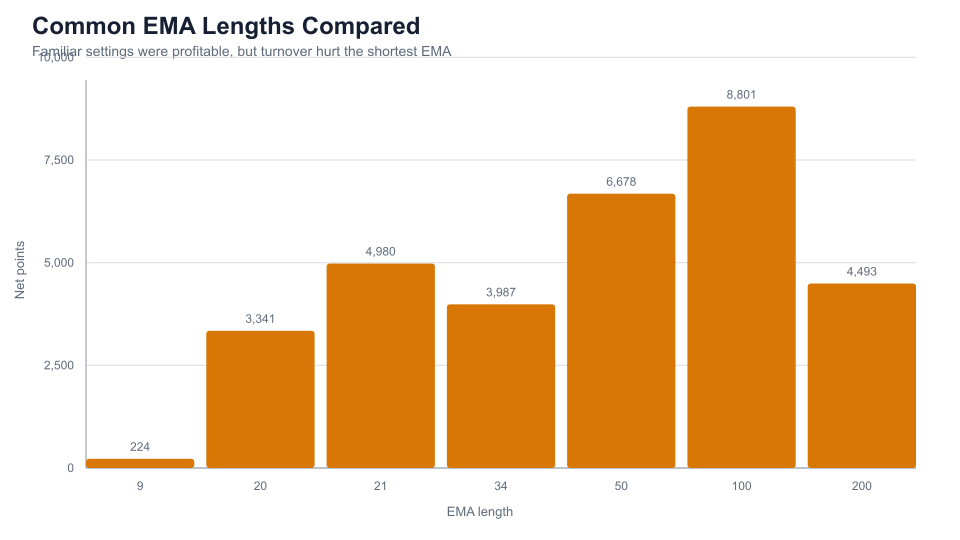
How Common EMA Lengths Compared
Traders often use familiar values like 9, 20, 21, 34, 50, 100, and 200. In this test, those lengths performed very differently.
| EMA Length | Net Points | Est. Net $ | Trades | Win Rate | Profit Factor | Max Drawdown |
|---|---|---|---|---|---|---|
| 9 | 223.6 | $4,472 | 16,145 | 27.7% | 1.00 | 6,591.6 pts |
| 20 | 3,340.8 | $66,816 | 10,597 | 24.7% | 1.03 | 4,004.2 pts |
| 21 | 4,980.3 | $99,606 | 10,275 | 24.5% | 1.04 | 3,410.1 pts |
| 34 | 3,987.2 | $79,744 | 7,972 | 21.4% | 1.04 | 2,816.3 pts |
| 50 | 6,678.5 | $133,570 | 6,364 | 20.8% | 1.08 | 2,096.6 pts |
| 100 | 8,800.6 | $176,012 | 4,371 | 17.0% | 1.14 | 3,224.0 pts |
| 200 | 4,493.4 | $89,868 | 3,013 | 14.7% | 1.09 | 3,738.9 pts |
The 9 EMA barely survived after costs. It flipped more than 16,000 times, which is exactly the problem with fast moving averages on 5-minute futures data: they react quickly, but they also respond to a lot of noise.
The 50 EMA was a much stronger common setting. It made less than the 94 EMA, but it had a smaller max drawdown in this sample. The 100 EMA was closer to the best zone and performed well, but it still lagged EMA 94 on net P&L, profit factor, average trade, and return-to-drawdown.
One Interesting Observation
The 9 EMA produced more than **16,000 trades** but barely broke even after costs.
EMA 94 produced fewer than **4,500 trades** while generating dramatically higher net performance.
That difference is the core lesson of this EMA backtest futures study. In a market like NQ, transaction costs and market noise can dominate short-term systems. A fast EMA may feel more responsive, but responsiveness is not the same as profitability.
What This Says About EMA Length
For this NQ sample, the sweet spot was not the fastest EMA and not the slowest EMA. It was an intermediate trend filter around **90 to 100 bars**.
On a 5-minute chart, EMA 94 represents roughly 470 minutes of bars, or about 7.8 hours of market time. That makes it slow enough to avoid some small chop, but still responsive enough to catch large intraday and overnight directional moves.
The low win rates are also worth noting. Even the best EMA won only **17.7%** of trades. That sounds bad until you remember what this strategy is doing: it is a simple trend-following flip system. It takes many small losing flips and relies on fewer large directional moves to pay for them.
So the answer is not, “use EMA 94 and ignore everything else.” A better conclusion is:
> In this 5-minute NQ futures test, the best EMA length was 94, but the broader high-80s to mid-90s region was the real signal.
Why Did EMA 94 Work?
The strongest EMA lengths in this test were slow enough to filter out much of the intraday noise that damages shorter-term systems.
Fast EMAs reacted quickly, but they also flipped direction constantly during consolidations and rotational sessions. That created more trades, more cost drag, and more small losses.
Longer EMAs traded less frequently and captured larger directional expansions instead of reacting to every short-term pullback. The result was lower turnover, better average trade expectancy, and higher profit factors despite lower win rates.
That is why the best EMA for NQ in this test was not a very fast setting like 9 or 20. The better-performing EMA settings for futures were long enough to let the market move before forcing the strategy to reverse.
Could This Be Overfitting?
Possibly.
Any parameter sweep risks fitting to historical conditions that may not repeat in the future. If one EMA length had crushed every other setting while nearby values performed poorly, that would be a warning sign.
The encouraging part of this test is that the best results appeared in a broad cluster between **EMA 86 and EMA 96** instead of a single isolated value. Broad parameter stability is generally more useful than a sharp one-parameter peak.
That still does not prove the same EMA length will work in the next market regime. It only makes the result more credible than a one-off optimized setting.
Practical Takeaways
If you are using EMAs on 5-minute futures charts, the test suggests a few practical lessons:
– Very short EMAs can look appealing visually, but transaction costs and whipsaws matter.
– The 20 and 21 EMAs were profitable here, but they traded far more often and had weaker reward per trade.
– The 50 EMA was a reasonable common setting, especially if drawdown control matters more than absolute net P&L.
– The 100 EMA was close to the strongest area and may be easier to justify than optimizing around a precise value like 94.
– The best result came from a cluster, not an isolated outlier, which makes the finding more useful.
– For traders searching for the best EMA for futures trading, the test supports studying a zone of lengths rather than copying one exact number.
Limitations
This is a narrow test. It uses one futures market, one bar size, one data file, one cost assumption, and one simple strategy. It does not prove that EMA 94 will be best in the future or across other futures contracts.
The test also does not include position sizing, margin requirements, exchange fees, broker commissions, tax treatment, or live execution issues. The estimated dollar results use the NQ point value of $20 per point, but they should be read as a way to scale the point results, not as a complete trading-system performance report.
Bottom Line
In this backtest, the **94-period EMA performed best** on 5-minute NQ futures data. But the stronger lesson is that the best-performing EMA lengths were clustered around **86 to 96**, while very short EMAs suffered from excessive turnover.
For a trader, that makes the 90-to-100 EMA zone a more defensible starting point than chasing the exact top-ranked length.