August 15, 2026
Does the First 30 Minutes Predict the Rest of the NQ Trading Day?
By 10:00 a.m., NQ has already absorbed the cash-market open, the first wave of equity price discovery, and 30 minutes of regular-session order flow.
Traders often treat that opening period as a compressed preview of the day. A strong rally is supposed to signal a trend day. A wide opening range is supposed to warn that volatility will remain elevated. An opening high or low is supposed to become a level that matters for hours.
Those are three different claims. The data does not support them equally.
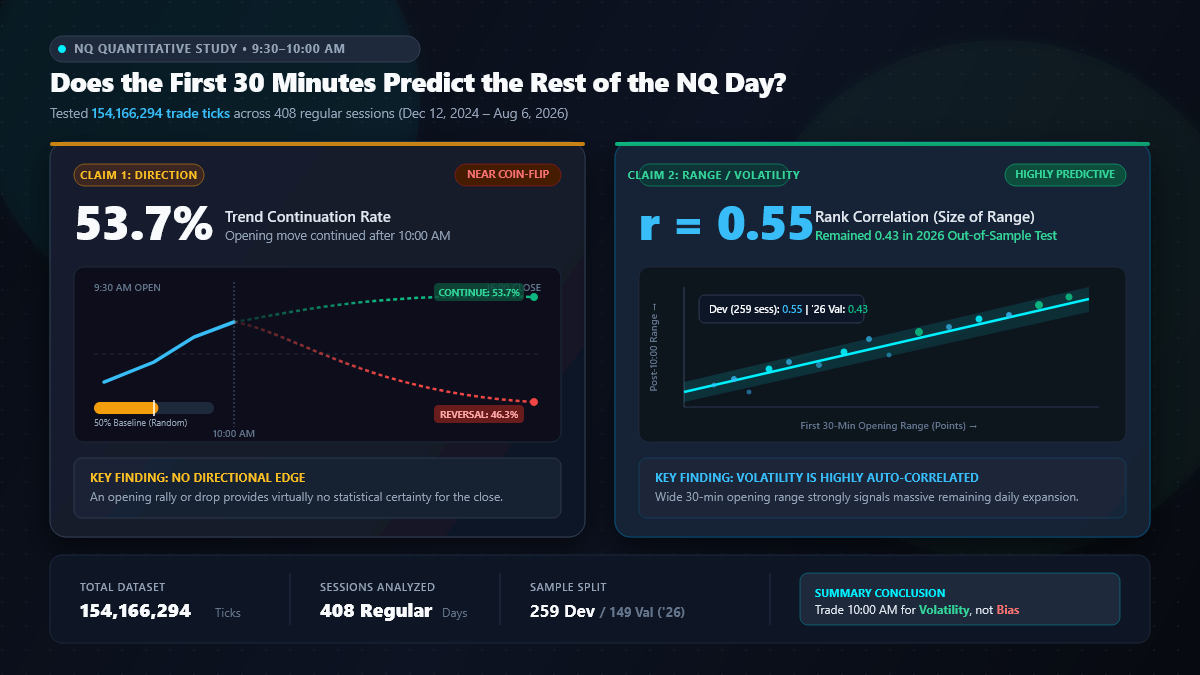
We tested 154,166,294 NQ trade records across 408 complete regular sessions, from December 12, 2024 through August 6, 2026. The first 259 sessions formed a development sample. The 149 sessions in 2026 were held out as a chronological validation sample.
The answer was surprisingly clean:
The first 30 minutes predicted the size of the remaining day’s range much better than they predicted its direction.
The opening move continued after 10:00 on 53.7% of NQ sessions, an advantage too uncertain to separate from chance. The opening range, however, had a 0.55 rank correlation with the range after 10:00. That relationship remained 0.43 in the held-out 2026 sample.
In other words, the open was useful context for how much NQ might move. It was not a reliable standalone answer for which way it would close.
What counts as a prediction?
The boundary matters.
The predictor window in this study is exactly 9:30:00 through 9:59:59 a.m. Eastern. The final trade before 10:00 is the reference price. Every outcome uses only trades from 10:00 through 4:00 p.m.
This prevents an easy analytical mistake. If the first 30-minute return is compared with the full-day return, the opening move appears on both sides of the equation. The same problem occurs if the opening range is compared with a full-day range that already includes it. Part of the apparent prediction would be arithmetic overlap.
Here, the opening range and the remaining range do not share a trade.
That also makes this test different from published work on intraday momentum. Gao, Han, Li, and Zhou found that the first half-hour return, measured from the previous close, predicted the last half-hour return in a long sample of the S&P 500 ETF. This study asks a harder and more trader-specific question: does NQ’s move from 9:30 to 10:00 predict the entire six-hour period that follows?
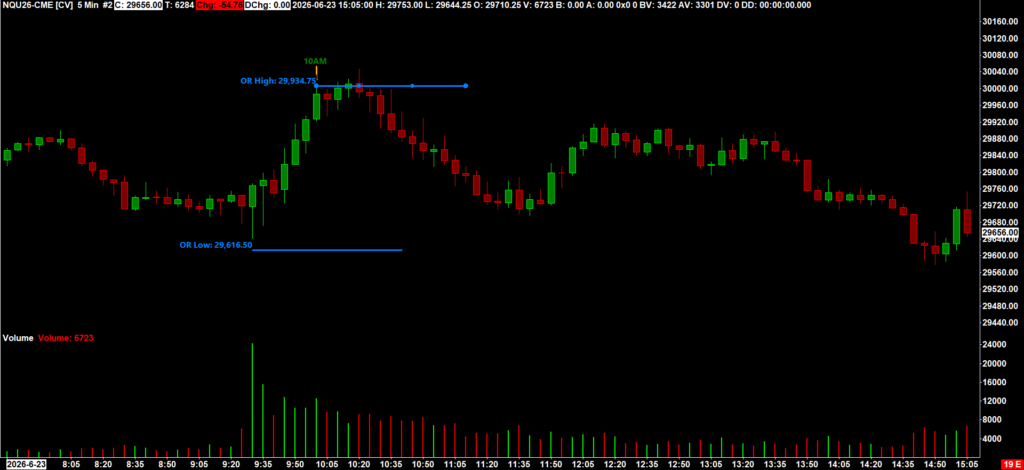
June 23, 2026 illustrates the study’s central finding. NQ rallied 207.75 points before 10:00, then reversed and fell 276.25 points into the close. Direction failed to persist, but volatility did: the large 318.25-point opening range was followed by a 469.75-point range after 10:00.
Opening direction was a weak signal
The simplest directional rule is also the most transparent:
- If NQ was up from 9:30 to 10:00, predict an up move from 10:00 to 4:00.
- If NQ was down from 9:30 to 10:00, predict a down move afterward.
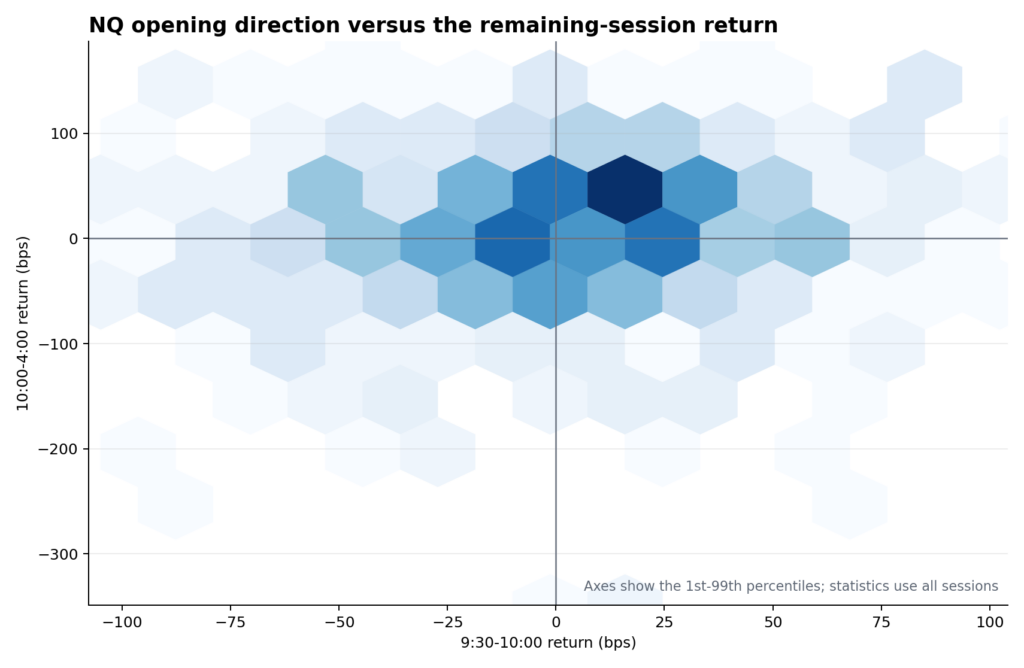
The chart does not show a strong diagonal relationship. Large opening rallies were followed by both gains and losses. The same was true after opening declines.
| NQ sample | Sessions | Continued after 10:00 | 95% interval | Median signed return | 95% interval |
|---|---|---|---|---|---|
| Development: 2024-25 | 259 | 53.7% | 47.5% to 59.5% | +5.8 bps | -4.4 to +18.1 |
| Validation: 2026 | 149 | 53.7% | 45.6% to 61.7% | +6.7 bps | -9.4 to +24.3 |
| Full sample | 408 | 53.7% | 49.0% to 58.3% | +6.2 bps | -1.5 to +15.8 |
“Signed return” makes continuation positive in either direction. A gain after an opening rally and a decline after an opening selloff both count as positive.
The full-sample hit rate was 3.7 percentage points above 50%, but its bootstrap interval included 50%. The return interval also crossed zero. Even the ex-post benchmark of always choosing the more common remaining-session direction reached 55.9% in the full sample, above the opening-direction rule.
This is not evidence that NQ always reverses after 10:00. It is evidence that the sign of the opening move, by itself, did not provide a dependable closing direction.
A cleaner opening move may contain more information
Not all first-30-minute moves look alike. A 50-point rally that closes near the top of a 60-point range is different from a 50-point rally inside a 200-point two-way auction.
To describe that difference without choosing point thresholds, I divided the absolute opening return by the opening range:
- Weak: the net move covered no more than one-third of the range.
- Moderate: the net move covered one-third to two-thirds.
- Strong: the net move covered more than two-thirds.
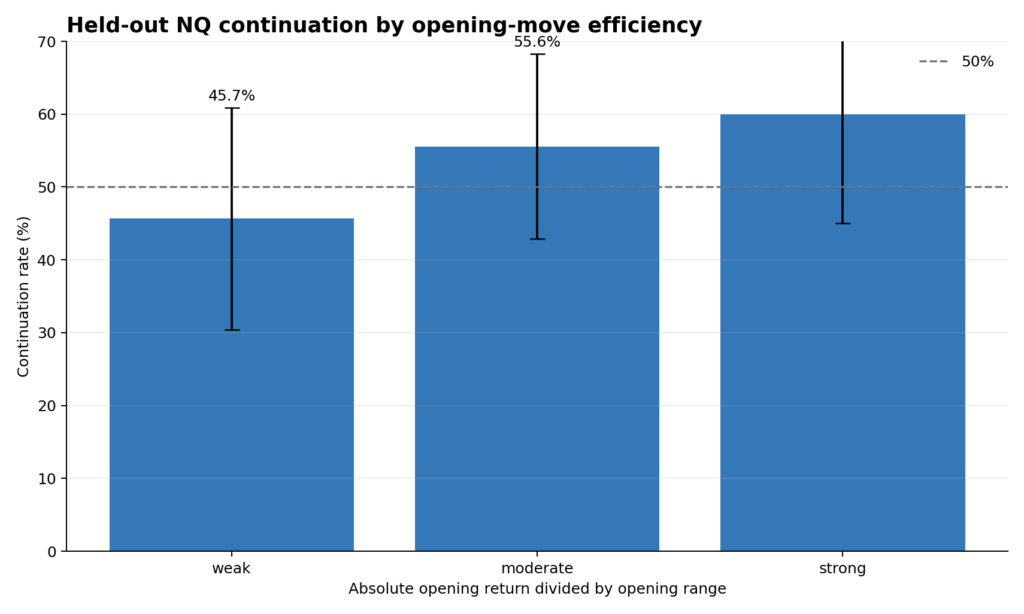
In the held-out NQ sample, weak moves continued 45.7% of the time, moderate moves 55.6%, and strong moves 60.0%.
That progression is interesting, but it is secondary evidence rather than a trading rule. The strong group contained only 40 validation sessions, and its 95% interval was 45% to 75%. The corresponding median signed-return interval also crossed zero. More data is needed before treating “clean” opening moves as a durable directional edge.
Opening range was much more informative
Direction asked whether the sign carried forward. The volatility test ignored sign and asked whether a wide 9:30-10:00 range preceded a wide 10:00-4:00 range.
It did.
The rank correlation between opening range and remaining range was 0.59 in the development sample, with a 95% interval of 0.51 to 0.67. In the untouched 2026 sample it remained 0.43, with an interval of 0.30 to 0.54.
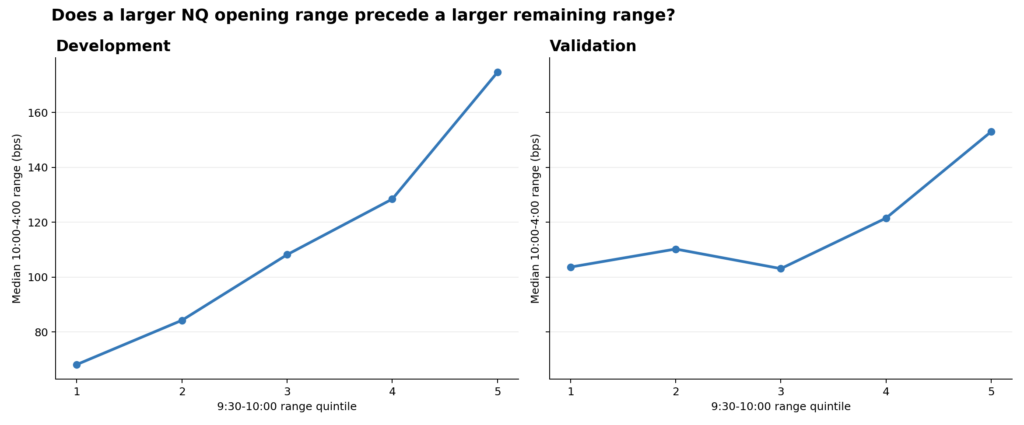
The development quintiles were fixed before examining the validation results. Those same basis-point boundaries were then applied to 2026 rather than re-ranking the newer sessions with future information.
| Opening-range bucket | Development sessions | Median later range | Validation sessions | Median later range |
|---|---|---|---|---|
| Smallest | 52 | 68.1 bps | 6 | 103.6 bps |
| 2 | 52 | 84.2 bps | 17 | 110.2 bps |
| 3 | 51 | 108.2 bps | 41 | 103.1 bps |
| 4 | 52 | 128.4 bps | 42 | 121.5 bps |
| Largest | 52 | 174.7 bps | 43 | 153.0 bps |
The held-out buckets were not perfectly monotonic, and only six 2026 sessions fell into the old lowest-range bucket. That imbalance is itself useful: 2026 was a higher-opening-volatility regime than much of the development period.
Despite the regime shift, the largest opening-range bucket still had a median remaining range of 153.0 basis points, and the session-level relationship remained clearly positive.
This is the strongest result in the study. Volatility clustered within the day even when direction did not persist.
The opening range was a reference, not a ceiling
Opening-range traders often draw the 9:30-10:00 high and low and wait for one side to break. In NQ, at least one side broke after 10:00 on 99.5% of the 408 sessions.
| Post-10:00 outcome | NQ sessions | Share |
|---|---|---|
| Only the opening high broke | 139 | 34.1% |
| Only the opening low broke | 119 | 29.2% |
| Both sides broke | 148 | 36.3% |
| Neither side broke | 2 | 0.5% |
The first break is not automatically a forecast. More than one-third of sessions eventually traded through both sides. A breakout entry, a failed breakout, and a close outside the range are different events and should not be collapsed into the same statistic.
Only 29.7% of opening highs remained the full-session high, while 34.6% of opening lows remained the full-session low. Those levels mattered because price interacted with them, not because they reliably contained the rest of the session.
ES produced the same broad answer
I repeated the fixed design on ES as a robustness check. The ES sample contains 294,952,545 trade records across 345 complete sessions. Its June 2025 contract file was empty, so that quarter was excluded rather than imputed.
| Instrument | Sessions | Direction continued | 95% interval | Opening/later range correlation | 95% interval |
|---|---|---|---|---|---|
| NQ | 408 | 53.7% | 49.0% to 58.3% | 0.55 | 0.48 to 0.62 |
| ES | 345 | 52.5% | 47.2% to 57.7% | 0.55 | 0.48 to 0.62 |
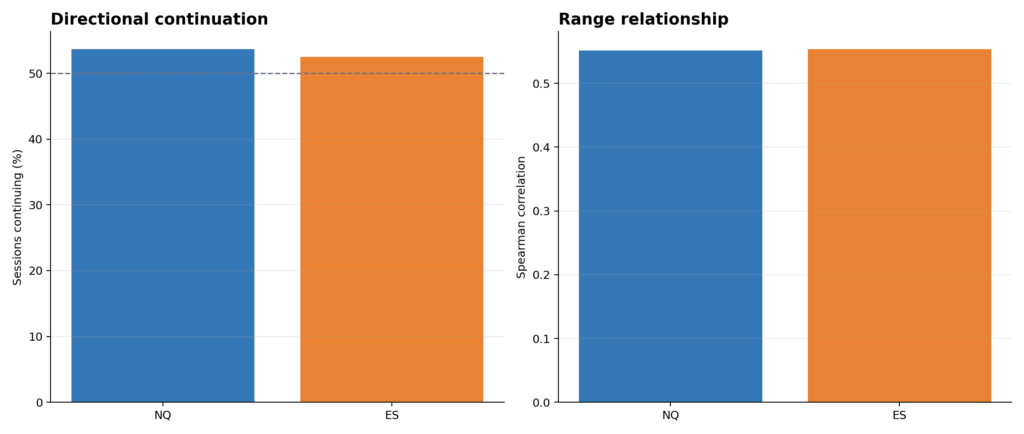
The similarity is more important than the exact decimals. Neither market showed a reliable unconditional continuation rate. Both showed a substantial relationship between early and later range. ES also retained a 0.56 range correlation in its held-out 2026 sample.
That cross-market result makes a contract-specific data artifact less likely, although it does not establish a universal law for other markets or periods.
Why the opening can predict volatility without direction
Nasdaq futures trade nearly around the clock, but 9:30 remains a distinct information and liquidity event. The underlying stocks begin regular trading, and Nasdaq’s Opening Cross brings opening orders together at 9:30 after publishing imbalance information before the bell.
A large opening range can therefore reveal that the session has an unusually high rate of information arrival, disagreement, forced repositioning, or demand for immediacy. Those conditions can persist after 10:00.
None of them determines direction. The same active environment can produce a trend, a reversal, or several swings. Volatility persistence and return momentum are separate properties.
The Sierra Chart data cannot identify the cause of a particular session’s activity. The interpretation is narrower: the amount of price discovery in the opening window carried information about the amount still to come.
Practical implications
Use the range as a risk input
A large opening range was associated with a larger remaining range in both NQ and ES. That makes it relevant to stop distance, target distance, position size, and expectations for the rest of the session.
It does not mean multiplying the opening range by a fixed number will forecast the exact high and low. The relationship is probabilistic, with substantial variation around it.
Do not confuse a green open with a trend day
An opening rally did not make an afternoon rally dependable, and an opening selloff did not make a lower close dependable. Direction needs more context than the sign of the first 30 minutes.
Treat move quality as a research lead
Efficient opening moves continued more often than weak, two-way moves in the validation sample. That result is plausible and appeared without selecting a point threshold, but the subgroup intervals were wide. It deserves another sample, not immediate promotion to a strategy.
Expect the opening levels to trade again
NQ broke at least one side of its opening range on nearly every session, and often broke both. The level can organize a trade plan, but touching or crossing it is not sufficient evidence of follow-through.
Methodology and limitations
The analysis used Sierra Chart Denali data for active quarterly NQ and ES contracts. Contracts rolled on the Thursday before quarterly expiration. Only sessions with records spanning the complete 9:30 a.m.-4:00 p.m. Eastern regular session were included. Early closes and incomplete files were excluded.
The 10:00 reference was the final trade strictly before 10:00. A session also needed a trade within 60 seconds on both sides of that boundary; every included session passed. Predictors used only the 9:30-10:00 records. Outcomes used only the 10:00-4:00 records.
Range is the highest traded price minus the lowest traded price inside the specified window. Results were normalized in basis points for comparisons through time and across NQ and ES. Directional continuation required the opening return and remaining return to have the same sign. Two ES sessions with a zero opening return were excluded only from that directional measure.
Confidence intervals used 10,000 fixed-seed resamples of complete sessions. The development period ended December 31, 2025. Opening-range quintile thresholds came only from that period and were carried unchanged into 2026.
The study is descriptive and predictive, not causal. It does not control for economic-release days, Federal Reserve announcements, option expiration, or news. It does not model commissions, slippage, entries, stops, targets, position sizing, or overnight risk. A correct directional label also does not imply a tradable path between 10:00 and the close.
The sample covers fewer than two years and contains several volatility regimes, but not a full market cycle. The directional-efficiency breakdown and opening-range breakout results are secondary analyses and should be treated as hypotheses for future validation.
The durable conclusion is simple: the first 30 minutes were a useful volatility forecast and a weak directional forecast. The opening told us more about the kind of day NQ was entering than where that day would finish.
Futures trading involves substantial risk and is not suitable for every trader. This analysis is educational and is not individualized investment advice.