October 11, 2026
Does VWAP Really Act as Support and Resistance?
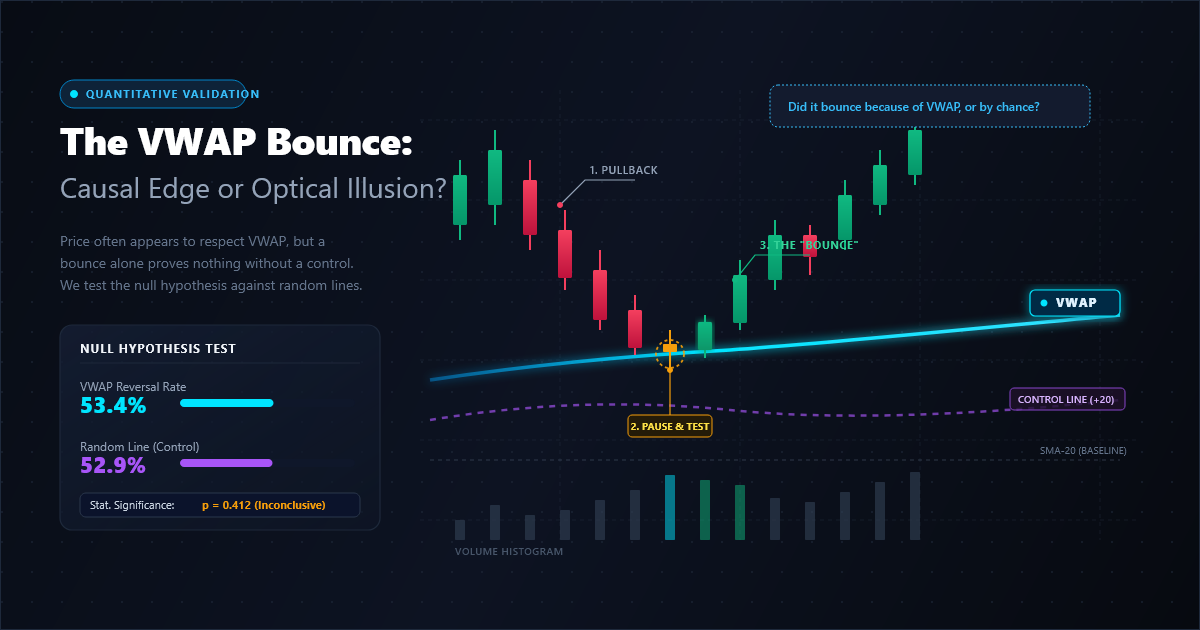
Price pulls back to VWAP, pauses, and bounces. It is an easy chart to remember: the market seems to have recognized the day’s volume-weighted average price and defended it.
But a bounce alone does not establish that VWAP mattered. To test that claim, we need a comparison: does price bounce more reliably at VWAP than at other lines tested the same way?
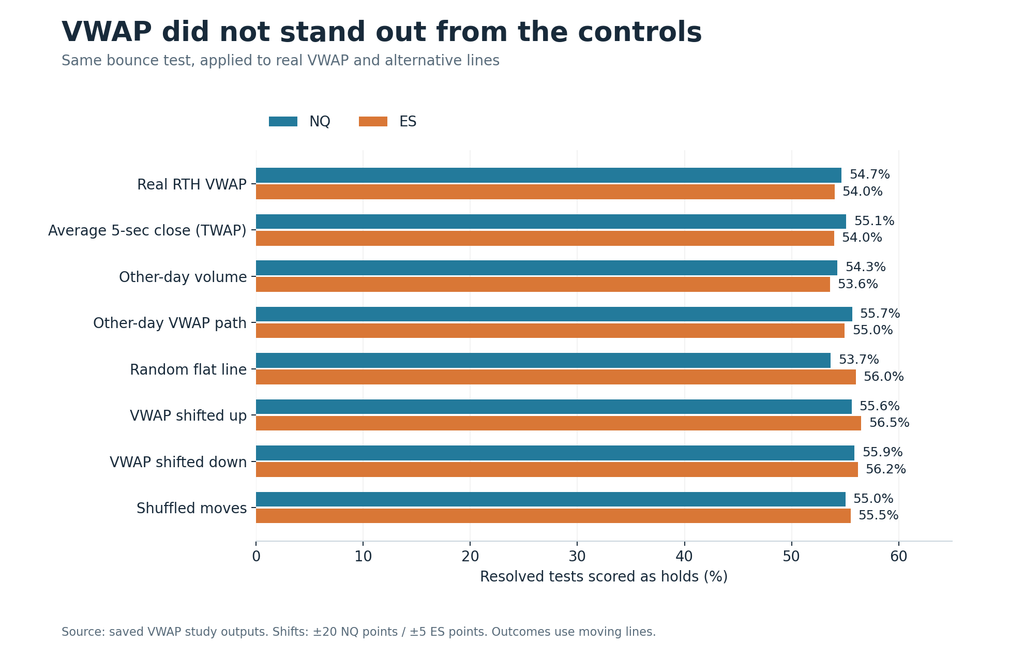
In this study, the answer was no clear advantage. Across 395 complete NQ sessions, regular-session VWAP held 54.7% of resolved tests. Shifted copies of VWAP pooled together held 55.4%. A shuffled-moves control, with VWAP recomputed on the shuffled price path, held 55.0%.
The ES sample told a similar story. The finding challenges a specific claim—that touching VWAP is, by itself, a distinctive bounce signal. It does not settle every possible use of VWAP.
What counts as a VWAP hold?
VWAP is the sum of trade price multiplied by trade volume, divided by total volume. Here it resets at 9:30 a.m. Eastern and includes trades during the regular session.
The study used Rithmic trade records stored in Sierra Chart files. VWAP was calculated from trade-level price-volume sums, then evaluated using five-second bars. The saved results cover December 13, 2024 through July 27, 2026 for NQ, and December 12, 2024 through July 27, 2026 for ES.
For NQ, the base test worked as follows:
- A five-second bar had to sit entirely at least 15 points above or below the line to arm a test.
- Price then had to reach within 2 points of the line. The reference was the line’s value at the end of the preceding bar.
- A test from above held if price subsequently reached 15 points above the moving line before reaching 15 points below it. A test from below used the reverse rule.
- After an outcome, the line had to arm again before another test could begin.
Tests began between 9:45 a.m. and 3:45 p.m., with outcomes allowed through 4:00 p.m. ES used one-quarter of the NQ distances: 3.75 points to arm, a 0.5-point touch tolerance, and 3.75-point outcome distances.
Of 3,872 NQ VWAP tests, 2,113 held and 1,752 broke. Six were ambiguous and one remained unresolved, leaving 3,865 scored tests.
These are event outcomes, not executed trades. The target and break thresholds follow the moving line; the study does not model entries, commissions, slippage, or fixed stop orders. The code also treats the touch bar specially: a break can resolve immediately, but a hold cannot be credited until a later bar. Those rules apply equally to the comparison lines.
The comparison is the finding
Several controls asked whether VWAP’s construction added anything distinctive:
- Shifted VWAP kept the same shape but moved it to another price.
- A random flat line removed the intraday movement of the reference line.
- Another session’s VWAP path was aligned to the current session’s opening reference.
- A time average removed volume weighting. In the implementation, this is the running average of five-second closing prices.
- A wrong-volume control used current-bar typical prices with another session’s volume weights.
For NQ, a random flat line held 53.7% of the time. The time average held 55.1%. VWAP shifted up 20 points held 55.6%, and VWAP shifted down 20 points held 55.9%. Real VWAP’s 54.7% sat among those results.
ES provided a second instrument comparison: real VWAP held 54.0% across 3,422 resolved tests, versus 56.0% for a random flat line and 55.5% in the shuffled-moves control.
Tests within a session can be related, so uncertainty was measured by resampling whole sessions rather than treating every touch as independent. The saved analysis used 2,000 paired session-bootstrap resamples for each real-versus-control comparison.
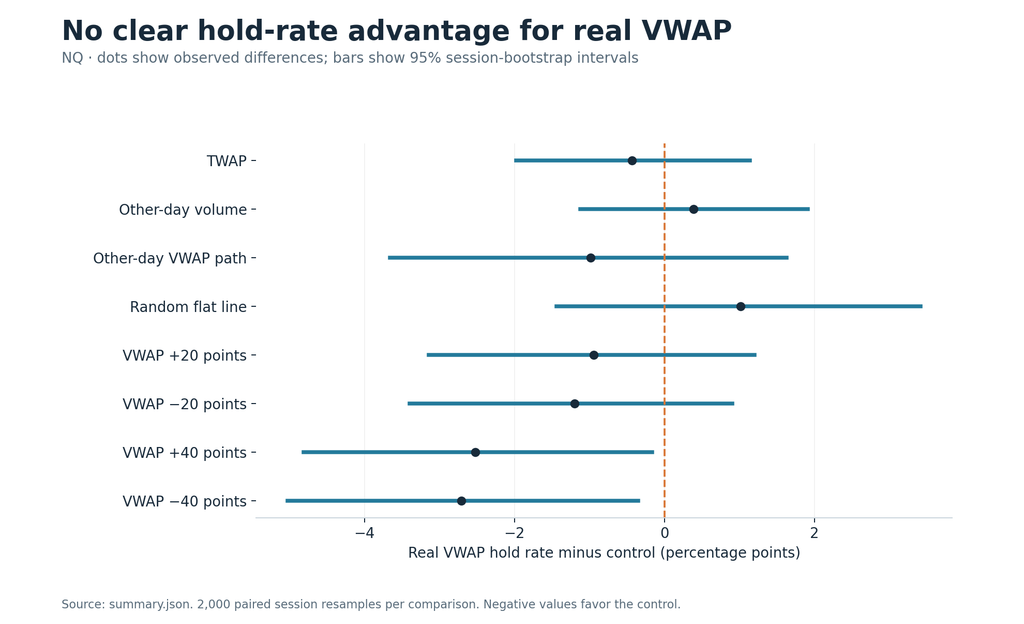
The lines shifted 40 NQ points away actually held more often, with intervals favoring those controls. One possible explanation is that displaced lines select different market conditions, including touches nearer session extremes. That mechanism was not established by this study, and the result is not a tested strategy for trading shifted lines.
Why 55% is not necessarily an edge
A hold rate above 50% sounds promising until the same scoring method produces a similar result after the sequence of price moves is scrambled.
The shuffled control reordered each session’s five-second moves, carrying their associated ranges and volume with them, and recomputed VWAP on the resulting path. Across three shuffled passes, its NQ hold rate was 55.0%.
That is evidence that a rate near 55% can arise from the event definition and properties retained by the shuffled data. The touch tolerance and moving reference are plausible contributors, although this experiment does not isolate their individual effects. Shuffling also preserves features such as the day’s collection of moves and net change; it is not a model of every possible random market.
The relevant hurdle is therefore the result of comparable controls under the same rules. Exceeding 50% alone does not demonstrate that VWAP supplies the signal.
The first test did not rescue the setup
Perhaps VWAP matters most on its first test, or after price has spent a long time away. The saved breakdowns checked those ideas too.
The first NQ test of the day held 50.5% of the time across 384 resolved events. The pooled shifted controls held 52.2%. Later tests held 55.1% at real VWAP and 55.8% at the controls.
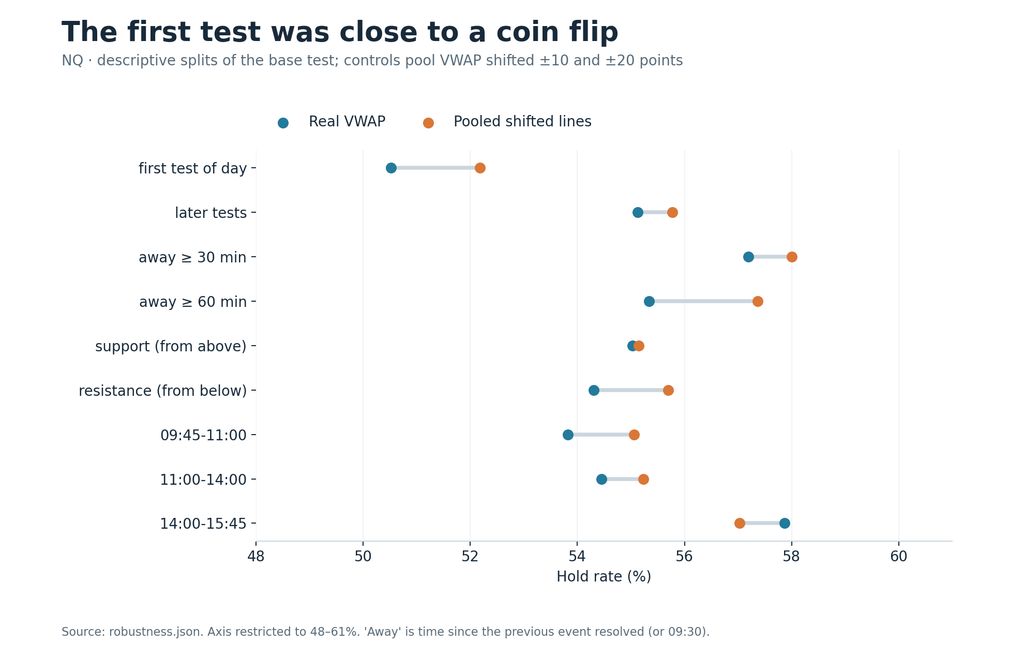
Most displayed splits favored the controls. The afternoon split modestly favored real VWAP: 57.9% versus 57.0%. That small descriptive difference does not establish an afternoon edge, particularly after looking across multiple splits.
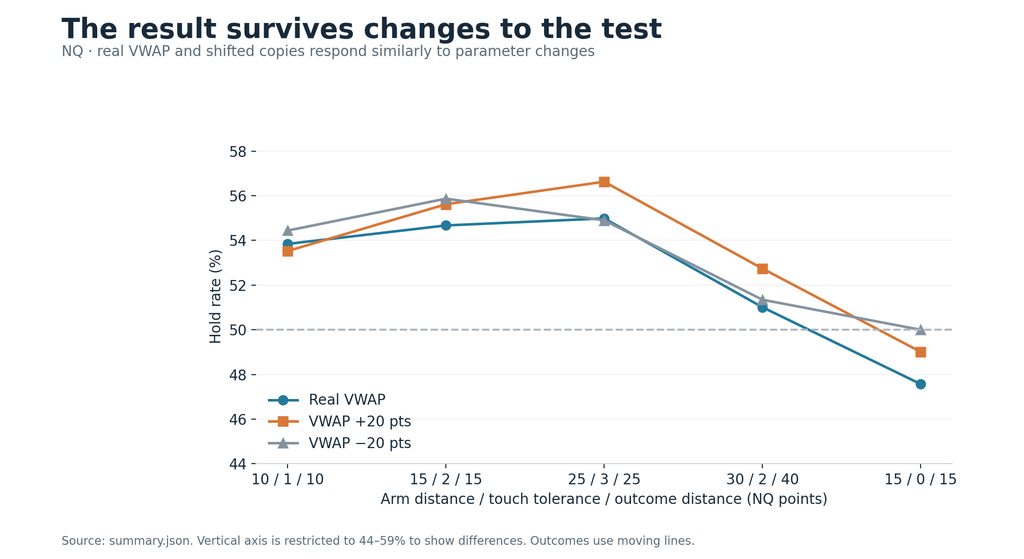
Changing the main distances did not reveal a consistent advantage either. With a 10-point arm, 1-point tolerance, and 10-point outcome distance, real VWAP held 53.8%. With 25 / 3 / 25, it held 55.0%. Requiring an exact touch reduced the hold rate to 47.6%, while shifted controls also fell toward 50%.
Why screenshots are so persuasive
On September 23, 2025, NQ produced seven VWAP holds and no breaks. It is exactly the kind of session that makes the indicator look compelling.
On May 6, 2025, real VWAP produced one hold and seven breaks, while VWAP shifted 30 points higher produced 16 holds and one break under the same rules.

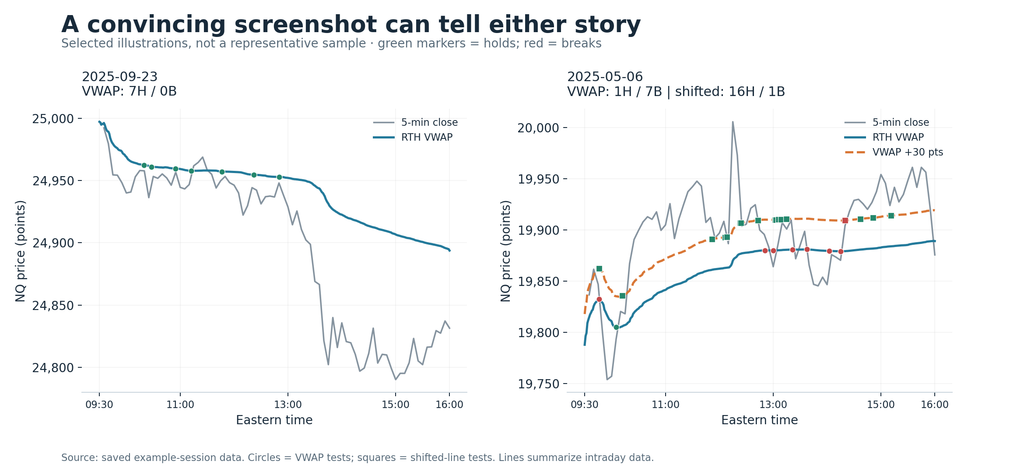
A memorable chart can demonstrate that a line worked on one day. Establishing an advantage requires the full sample, consistent definitions, suitable controls, and uncertainty estimates.
What the results support
VWAP still describes the volume-weighted average price paid during the chosen session. What this study failed to find was a clear bounce advantage from touching that line alone.
The scope matters: these results concern the specified instruments, sample, event rules, and moving-line outcomes. They do not evaluate VWAP standard-deviation bands, execution algorithms, or strategies that combine VWAP with other information. Nor do they establish trading profitability.
For this test, the central observation is simple: VWAP held about 55% of the time, and the controls did too. A visible bounce was common; evidence that VWAP made the bounce special was missing.
Research done on Rithmic data. Not financial advice