
January 24, 2026
Global Copper Market Analysis – January 2026
Figure: LME Copper prices surged to record highs approaching \$13,300 per metric ton (≈\$6 per pound) in early January 2026, reflecting a strong uptrend. Copper’s spot price currently hovers around \$5.9–\$6.0 per pound (near \$13,000/t) after a massive rally in late 2025[1][2]. On the London Metal Exchange (LME), copper jumped 22% from under \$11,000/t at November’s end to an all-time high of about \$13,387/t on January 6[1]. The CME COMEX front-month contract similarly neared \$6/lb in mid-January[2]. This spike marked one of the strongest price rallies in decades, fueled by tight supply and robust demand. Volatility has been elevated – in 2025 there were dozens of days with >\$0.10/lb daily swings, including a \$0.66/lb jump on July 8 and a \$1.24/lb plunge on July 31 around U.S. tariff news[3][4]. Notably, copper is up ~39% year-on-year[5], outpacing many assets.
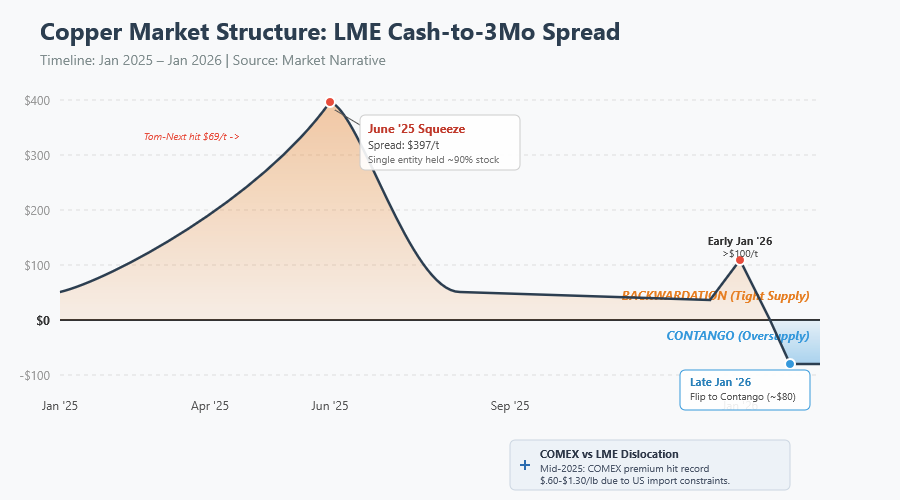
Futures Curve: The copper forward curve has fluctuated between backwardation and contango as market tightness ebbed and flowed. Earlier this week, LME time-spreads signaled extreme tightness – on Tuesday the cash price traded over \$100/ton above 3-month (backwardation), indicating a scramble for immediate metal[6]. By Thursday, however, a wave of deliveries into warehouses flipped the structure to a contango of about \$80/t (spot below 3-month)[7]. This sharp reversal highlights slightly improved near-term supply. Generally, the COMEX curve has been distorted by U.S. stockpiling and often showed a premium, while LME’s curve intermittently steepened into backwardation at times of acute shortage[8][9]. As of late January, the LME curve is relatively flat to modestly contango out to 3 months, after having been in backwardation through much of Q4 2025[6][10]. This suggests that while immediate physical tightness has eased slightly, the market remains finely balanced.
Technical Levels: From a technical perspective, copper broke through historic resistance in the \$5.00–\$5.50/lb range in 2025 and is now in uncharted territory around \$5.8–\$6.0. Key support now resides around \$12,000/t (~\$5.44/lb), the previous breakout zone[1]. On monthly charts, the trend is strongly bullish – prices have formed higher highs/lows and are “hugging the upper Bollinger Band,” indicative of a powerful uptrend rather than a mean reversion phase[11]. Momentum indicators confirm strength: e.g. the ADX trend strength is high (~40) with positively aligned DI+[12]. If the rally continues, psychological milestones like \$15,000/t (≈\$6.80/lb) would be the next upside target cited by bulls[13]. Conversely, any correction might test the mid-\$4s per pound if bearish catalysts emerge, though fundamental support is expected on dips.
Primary Price Drivers: The recent copper surge has been driven by a confluence of factors. Tight physical supply and low inventories have been paramount – traders describe a “structural deficit” underpinning the market[14]. Unplanned mine disruptions in 2025 removed significant tonnage just as demand from electrification projects accelerated[15]. At the same time, booming demand for copper’s use in electric vehicles (EVs), renewable energy, and data centers has reinforced a robust consumption outlook[15][16]. Another driver is institutional investment: as gold and silver hit lofty valuations, some big investors rotated into copper as an undervalued play on the energy transition. This “Dr. Copper” narrative – copper as both an economic barometer and a strategic asset – attracted new inflows in 2025[17][18]. Macro tailwinds have also aided prices: the U.S. Federal Reserve’s pivot to interest rate cuts (beginning Dec 2025) weakened the dollar and improved prospects for industrial activity[19][20]. Indeed, a softer USD (index down into the 95–100 range) has made dollar-priced metals cheaper globally[19]. In short, copper’s record-high pricing reflects a perfect storm of constrained supply, strong forward demand, investor interest, and supportive macro conditions.
Market Structure and Inventories
Paper vs Physical Dynamics: The copper market is exhibiting an unusual bifurcation between the “paper” futures market and the physical trade. On one hand, speculative interest is very high – money managers built record net long positions on COMEX through late 2025, reflecting bullish sentiment (though as a share of open interest, longs are not yet as extreme as past peaks)[21]. On the other hand, the physical side has been exceptionally tight outside of the U.S., leading to periodic squeezes. This dynamic led to “acute stress in the exchange’s unique date structure”, as LME inventories plunged and big position holders vied for scarce deliverable metal[22][8]. At times, dominant longs on LME have had to be checked by exchange rules to prevent market corners[23]. The LME even implemented stricter position limits in mid-2025 to manage these distortions, extending lending caps on large longs through the front month[24][25]. Overall, while futures prices signal bullish expectations, it’s the tight physical availability that has largely driven the curve into backwardation and boosted spot premiums until very recently[26][27]. This indicates that the paper market remains grounded in real supply-demand tightness rather than mere speculation.
Backwardation/Contango: The relationship between near-term and forward prices has been a key barometer of market health. Through much of 2025, copper traded in backwardation – spot commanding a premium over futures – as buyers scrambled for immediate supply. In June 2025, for example, LME’s cash-to-3mo spread blew out to \$397/t backwardation, the widest since 2021[8][28]. Even the overnight “tom-next” spread spiked to an eye-watering \$69/t backwardation during that squeeze[8]. Such extremes are rare and reflected one entity holding ~80–90% of available LME stocks at the time[24]. Fast-forward to January 2026: the market saw another mini-squeeze early in the month (briefly >\$100/t backwardation) but by late January the nearby spread eased into contango as metal flowed into warehouses[6][10]. As noted, LME spot is now ~$80/t below 3-month, indicating temporary relief in supply[6][10]. This flip from backwardation to contango within days underscores the fragile equilibrium – a modest inventory injection or drawdown can rapidly swing the structure. The expectation is that backwardation could return on any supply jolt, given low buffer stocks. Meanwhile, COMEX futures, which are for duty-paid U.S. cathode, have often traded above LME (contango vs LME) because of the unique U.S. import situation – at one point in mid-2025, COMEX contracts commanded a \$.60–\$1.30/lb premium over LME, a record gap[29][30]. That premium narrowed after the U.S. chose not to tariff cathode in August 2025[29], but U.S. prices still carry a logistics premium. In short, while the global curve now is flatter, any renewed stress could reinstate backwardation, especially on the LME which remains the “market of last resort” for physical metal.
Exchange Inventories: Visible copper inventories on exchanges tell a story of dramatic redistribution. COMEX (CME) warehouse stocks have surged to all-time highs, reaching ~453,000 tonnes by late 2025 – nearly five times higher than January 2025[31][32]. This unprecedented build is the result of traders funneling metal into U.S. warehouses to arbitrage a higher U.S. price (and to pre-empt potential tariffs)[33][34]. By contrast, LME stocks have been drained. LME on-warrant copper inventories fell ~59% year-over-year in 2025[35]; from over 250,000t in early 2025 they plunged below 100,000t by mid-year[36][37]. Available LME tonnage hit a two-year low of ~54,500t in June[38]. Although LME stocks have partially rebuilt to about 150–170,000 tonnes as of Jan 2026 thanks to recent deliveries[39][40], the bulk of those inflows actually came in the U.S. and Asian LME warehouses via exports from China (more on that below). The Shanghai Futures Exchange (SHFE) inventories have been more stable; China’s refined stocks modestly rose in late 2025 amid soft domestic demand, enabling China to become a net exporter of refined copper in recent months[40][41]. Indeed, Chinese smelters seized an arbitrage opportunity in Q4: with LME prices higher than Shanghai, they shipped metal to LME warehouses in Asia, easing the LME squeeze[40][42]. This helped boost LME stocks in Singapore and Busan and contributed to the contango now seen. Still, global inventories ex-US remain critically low, meaning the market outside North America has minimal cushion. Analysts describe this as “operational fragility” – the world excluding the U.S. is operating with thin buffers, so any disruption has outsized impact[35][43]. In summary, record stockpiles in America and depleted inventories elsewhere have created a fragmented market with unusual regional spreads.
Warehouse Spreads & Premiums: The tight inventory situation has manifested in regional premiums and spreads. In late 2025, a huge physical premium opened up for U.S. delivery: at its peak in July, CME copper was \$1.30/lb (≅\$2,860/t) more expensive than LME’s global price[30][44]. Normally this spread is just a few cents[45]. That premium has since narrowed significantly (after the U.S. held off on cathode tariffs), but it underscored the impact of trade policies on market structure. In Europe, premiums for physical copper (e.g. CIF Rotterdam or delivered Germany) have been relatively steady in the \$85–\$100/t range[46], but could soften if more metal is re-routed from China. In China, physical cathode premiums turned to discounts at times as domestic demand lagged and exports surged. On the LME, time-spread volatility has been extreme – as noted, nearby spreads swung wildly from backwardation to contango within a week in Jan 2026[7]. The LME’s role as a balancing mechanism has been tested by these distortions, prompting the exchange to caution against both unbridled longs and shorts to maintain orderly trading[47][48]. Importantly, despite the recent easing, any renewed drop in stocks (or fresh positioning) could see cash-3M spreads blow out again. Traders are therefore laser-focused on daily warehouse warrant data and cancellation notices as leading indicators for spread moves[49][50].
Treatment/Refining Charges (TC/RCs): In the physical concentrate market, smelting terms have collapsed to unprecedented lows, underscoring how tight mine supply is. The annual benchmark TC/RC for 2026 was settled at an astonishing \$0 per tonne and 0¢/lb – effectively no fee at all for processing copper concentrate[51]. This compares to \$21.25/t + 2.125¢/lb for 2025[52], which itself was a multi-year low. In fact, by late 2025 spot TCs had turned negative, meaning smelters were paying miners a premium (instead of charging a fee) to secure concentrate[53]. Such a scenario is virtually unheard of; it indicates that miners hold all the bargaining power due to scarce supply. Major mine outages (e.g. Grasberg in Indonesia and Kamoa-Kakula in DRC) tightened the concentrate market so much that Chinese smelters agreed to zero fees just to obtain material[53]. The implication is that smelters’ margins are getting squeezed, and indeed China’s top smelter group announced plans to cut output by over 10% in 2026 to cope with the concentrate shortfall[54]. Low TC/RCs are bullish for copper prices, as they discourage full utilization of smelters (limiting refined output) and transfer more profit to miners – potentially incentivizing mine production if possible. It’s worth noting that some smelters find relief via by-product credits or blending, but many will struggle if this situation persists. In summary, the collapse of TC/RCs to zero is a dramatic indicator of how supply-constrained the upstream copper segment is, and it validates why refined prices are so high.
Fundamental Supply and Demand
Mine Production Trends: Global mine output has been running below expectations, contributing to the tight market. In 2025, numerous disruptions kept production nearly flat – global copper mine growth was only about +1% Jan–Nov 2025[55][56], far below initial forecasts. Key setbacks included accidents and maintenance outages at top mines: for example, Indonesia’s Grasberg mine had significant downtime and Chile’s output fell ~1.3% as gains at some operations were offset by losses at others[57]. Even the massive new Kamoa-Kakula mine faced hiccups, and Peru dealt with intermittent community protests (e.g. Las Bambas saw blockades earlier) before recovering later in the year. On the positive side, a few new sources ramped up: the Democratic Republic of Congo (DRC) increased output ~6.5% with Kamoa’s expansion and the Tenke Fungurume restart[58], and Mongolia’s Oyu Tolgoi underground expansion boosted that country’s output by 34%[58]. These helped offset some losses. Looking ahead, 2026 should see better mine growth – Fitch’s BMI forecasts a +3.3% rise in mine production, assuming major operations return to normal capacity[59][60]. That hinges on Grasberg, El Teniente (Chile), and Kamoa all ramping back up fully[60]. However, there’s risk in those assumptions; any delay in mine recovery will prolong the supply squeeze. Furthermore, new greenfield projects are limited – the pipeline of new large copper mines is sparse due to years of underinvestment and lengthy permitting. The International Copper Study Group (ICSG) actually expects 2025 to have ended in surplus on paper[61][62], but that “surplus” was largely locked in U.S. warehouses and not freely available to the world. Many analysts instead see 2026 flipping into deficit. For instance, J.P. Morgan projects a ~330,000 tonne refined deficit in 2026[63], and other studies likewise predict a sizeable shortfall given demand growth. In summary, mine supply remains a concern – even if some rebound occurs in 2026, it may not be enough to satiate booming demand, especially with unforeseen outages (like strikes or technical failures) an ever-present risk.
Refining & Scrap Supply: The bottleneck is not just at the mine – refining capacity and feedstock are also constraints. Refined copper production actually rose about 4.2% in 2025 (helped by China’s smelter output and new DRC refineries)[56][61], but much of that was consumed by China’s own demand and by stock building. Ex-China refined output was flat or down as smelters outside China struggled with concentrate shortages[56]. In 2026, refined production growth is expected to decelerate to ~+1% globally[64][65]. The drastic drop in TC/RCs confirms smelters cannot secure enough concentrate to run at full tilt. Chinese smelters have even pre-emptively curtailed some plans (as noted, a coordinated 10% output cut for 2026)[54]. This means despite new refining projects in places like China and Africa, utilization may be suboptimal. One mitigating factor is scrap – high copper prices have incentivized greater collection and processing of scrap (recycled copper). Scrap flows improved in late 2025 as scrap yards saw more material coming in at these lofty price levels[66]. A U.S. recycler noted that “prices are up, so the flow of material… is decent”[66], although winter weather can slow collection. Interestingly, U.S. scrap dealers are exporting more high-grade scrap (bare bright, No.1 copper) than ever to markets like India, Japan, and South Korea[67]. This is because overseas consumers are paying better, while some U.S. brass mills had been assuming ample supply and bidding low[68]. That dynamic may shift as domestic buyers realize scrap isn’t as glutty as presumed. Overall, secondary supply (scrap) is providing some relief to the refined market – the ICSG noted recycled output is rising, and forecasts suggest global scrap usage could double by 2030[69]. But even a huge surge in scrap cannot fully bridge the gap if primary mine output falters; scrap contributes perhaps ~20-30% of total supply and is limited by collection rates. Thus, both primary and secondary supply streams are under pressure, underpinning the bullish fundamental picture.
Demand Drivers: Demand for copper is robust and evolving, underpinned by the global energy transition and infrastructure needs. Traditional uses like construction and consumer products remain important, but the fastest growth is in electrification-related sectors. Each battery electric vehicle uses roughly 50–80 kg of copper, far more than the ~23 kg in a gasoline car[70][71]. With EV production surging worldwide, this alone is adding significant incremental demand. Similarly, renewable energy is extraordinarily copper-intensive: offshore wind farms consume about 8,000 kg of copper per MW of capacity, onshore wind ~2,900 kg/MW, and solar ~2,800 kg/MW – several times the copper per MW of a coal or gas power plant[72][73]. Global investments in clean energy, from wind turbine farms to solar arrays and energy storage, are therefore boosting copper use. The International Energy Agency and others have highlighted that achieving climate targets will require millions of additional tonnes of copper in the coming decade. Another burgeoning demand segment is data centers and AI infrastructure: these facilities require extensive copper in electrical wiring, power distribution, and cooling systems. U.S. data center construction jumped ~26% in 2025 (annualized through August)[74], which translated into notable copper consumption for cable, busbars, etc. Market participants credited AI-related data center builds as a big contributor to U.S. copper uptake last year[75]. While that pace may level off, any expansion of high-performance computing globally (including China’s push in AI) will keep supporting demand[74].
Meanwhile, grid modernization and expansion is another demand pillar. China’s State Grid, for example, is mid-way through a \$300 billion power grid investment program (projecting \$80–100B in 2025 alone)[76] – such projects require vast amounts of copper for transmission lines, transformers, and substations. The U.S. and Europe are also investing in grid resilience and connecting renewable generation, adding to copper usage. Consumer and Construction: The more traditional side of demand – homes, appliances, electronics – is a mixed picture. China’s property construction remains a weak spot: real estate investment fell ~15.9% y/y in Jan-Nov 2025[77][78], and manufacturing PMI readings have been below 50, indicating contraction[78]. This dragged on Chinese copper demand for wiring, HVAC, etc., in the building sector. However, China’s losses are somewhat offset by gains in EVs and renewables domestically[79], plus the government’s efforts to stimulate other infrastructure. In the U.S., construction demand has been steadier (supported by infrastructure spending and a surprisingly resilient housing market), though higher interest rates in early 2025 slowed some building activity. Europe’s demand in industrial sectors was sluggish in 2024–25 due to energy costs and recession fears, but green investments (EV factories, grid links) are helping. The net effect is global refined copper demand is estimated to have grown ~4% in 2025[61], led by China’s ~5% consumption growth and moderate growth elsewhere[61][80]. For 2026, consensus expects continued demand growth on the order of 2–4%, with weakness in Chinese property and global manufacturing balanced by strength in electrification and infrastructure. Copper’s role as an essential material for the 21st century economy (“the new oil” in some narratives) means even if GDP slows, certain strategic sectors will keep copper consumption elevated.
Supply/Demand Balance: Putting it together, the fundamental balance is tight. Officially, the ICSG still showed a refined surplus of ~206,000t for the first 11 months of 2025[62][61] – the largest surplus since 2009 by some accounts[81]. But crucially, most of that “surplus” ended up as inventory in one place (the U.S.), so it did not alleviate scarcity elsewhere. Many analysts argue the market outside the U.S. was effectively in deficit in late 2025, given the drawdown in LME stocks and negative processing fees. As 2026 begins, the expectation is for a global deficit to emerge. Major banks like Goldman Sachs and Citi note that continued stockpiling in the U.S. alongside lackluster mine growth will likely create a supply shortfall on a worldwide basis[82][63]. Goldman predicts that once the U.S. tariff-driven hoarding is resolved later, the focus will turn back to a “well-supplied” global picture[83][84] – but in the short term (H1 2026) even they acknowledge a tight market. In fact, leading commodity analysts broadly see 2026 as a year where demand will outstrip available supply, at least for the first half[85][86]. This underpins the bullish outlook. The wild card will be China: if Chinese demand significantly underperforms (say, further property implosion or weaker exports), that could tip the balance back to surplus. Conversely, any new supply disruption (a major mine outage or slower ramp-up) would deepen the deficit. The consensus is that the copper market has very little margin for error in 2026 – even minor hiccups can tighten availability sharply, while any “surplus” is tenuous and regionally trapped.
Policy and Regulatory Impacts
Mining Policy and Permitting: Government policies in key producing countries are shaping copper’s supply trajectory. In Chile (the world’s largest copper producer), a new pro-growth administration under President-elect José Antonio Kast is vowing to streamline environmental permitting to spur mining investment[87][88]. The Chilean Mining Council welcomes easier permitting but cautions that meaningful new supply will take years to materialize even with faster approvals[89][90]. Chile has a pipeline of projects that could lift annual production from ~5.4 Mt to 7 Mt, but likely over a decade, not overnight[90][91]. Thus, while a friendlier policy environment in Chile is positive long term, it won’t significantly alleviate the current tightness in 2026. Chile’s challenge has been navigating strict environmental regulations and community opposition – e.g. protection of endangered chinchillas has delayed some mine expansions[92]. Any reforms that reduce red tape “without lowering environmental or social standards”[93] could eventually boost output. In Peru, political turbulence in recent years (including a 2022 change in government) and social conflicts have intermittently hit copper mines. For instance, MMG’s Las Bambas mine faced protests that curbed output, but an easing of community blockades in 2025 allowed production to rebound. The Peruvian government is working to mediate such conflicts, knowing copper is vital to its economy. Resource nationalism is another factor: countries like DRC, Zambia, Indonesia have at times considered higher taxes or export restrictions on copper to secure more value domestically. Indonesia, notably, has a long-standing plan to ban unrefined mineral exports – a ban on copper concentrate was slated for mid-2023 but was deferred, allowing Freeport’s Grasberg to continue exports while a new smelter is built. Any future enforcement of that ban (if Grasberg’s smelter faces delays) could suddenly restrict supply. Permitting delays, whether for new mines or smelter projects, remain a structural issue globally, contributing to the multi-year underinvestment problem.
Trade Policies (Tariffs and Export Controls): Perhaps the biggest policy wildcard for copper in 2026 is the U.S. Section 232 tariff saga. In early 2025, President Donald Trump ordered an investigation into copper imports on national security grounds[33]. This led to an expectation of tariffs on refined copper. The mere threat of tariffs caused a huge reshuffling: traders rushed to import cathode into the U.S. ahead of any duties, creating the aforementioned stockpile and U.S. price premium[33][94]. By July 2025, rumors of a Copper tariff blew the COMEX-LME spread out to \$1+ per pound[29]. However, when the policy was announced in August, it did not include unwrought cathode (it targeted only certain copper alloy products)[29][95]. COMEX prices promptly sank and the arbitrage gap narrowed[29][96]. The saga isn’t over: under the current plan, the U.S. Commerce Department must report by June 30, 2026 on whether to impose broad 15% tariffs on refined copper in 2027 (rising to 30% in 2028)[97][98]. This looming decision will be critical for market structure in 2026. If tariffs are confirmed mid-year, it could prolong U.S. hoarding through 2026 as consumers scramble to import before duties hit. That would keep LME (rest-of-world) supplies tighter for longer, supporting prices[82][99]. Conversely, if the tariff threat is dropped or delayed, one might see the huge U.S. inventories start to flow back out, which could flood the market and weigh on prices[100]. Goldman Sachs notes that once “tariff uncertainty passes,” focus will return to the actual global surplus, putting downward pressure on prices in late 2026[101][83]. In other words, the tariff question is currently buoying the LME price (by encouraging stockpiling), and a resolution could be a turning point. Aside from U.S. tariffs, export controls in other countries bear watching. China, for example, typically is a net importer of copper, but as mentioned it exported cathode recently due to arbitrage. If Chinese authorities were to discourage exports (to keep domestic supply ample), that could tighten LME availability again. So far there’s no indication of China limiting copper exports – in fact, Chinese smelters acted on market signals freely. Another angle is critical minerals policy: western governments are strategizing to secure critical mineral supply chains. While copper hasn’t faced the kind of export restrictions seen in niche metals (like China’s rare earth or gallium curbs), any shifts in trade policy as part of strategic resource planning could affect flows (for instance, if countries form alliances or stockpiles for copper).
Labor and Social Issues: High copper prices have emboldened labor unions at mines to demand a bigger share of profits, which has led to strikes and labor actions – a classic cyclical phenomenon in commodities. In Chile, workers at Capstone Copper’s Mantoverde mine went on strike on Jan 2, 2026, halting production at a site that was ramping up toward 106,000 tpy output[102][103]. The strike involved ~600 workers and even saw strikers obstructing a desalination plant to disrupt operations[104]. This stoppage is “further tightening the global market” according to Capstone, highlighting that even mid-sized mines are critical in the current tight balance[102]. The dispute reflects how “copper’s record rally is straining labor relations” – workers seek a share of windfall profits, while companies try to contain costs[105]. Similar dynamics have played out in Peru and elsewhere; in 2025, there were reports of intensified labor actions in both Chile and Peru as inflation and commodity profits put pressure on wage talks[106]. Each strike can remove thousands of tonnes from supply. If prices remain high, we could see more frequent labor disputes in 2026, which constitute a supply risk. Also on the social front, indigenous and environmental protests (common in Latin America) can cause temporary mine suspensions. The industry is watching negotiations and community relations closely – policy-wise, some governments are trying to mediate and offer benefit-sharing frameworks to avoid disruptions.
Index Rebalancing and Financial Regulations: Another January factor has been the annual rebalancing of major commodity indices (like the Bloomberg Commodity Index, BCOM). Copper’s weighting in BCOM for 2026 was actually increased (from ~5.4% to 6.36%) given its relative importance[107]. During the first half of January, index funds adjust positions – this year that likely meant net buying of copper (and some selling of outsized winners like precious metals)[108][109]. Any index-related flows were easily absorbed by the strong uptrend, with minimal noticeable impact amid the broader rally. Still, it’s a reminder of how mechanical fund flows can cause short-term volatility. On the regulatory side, exchanges have tightened risk controls after the 2022 nickel fiasco. The LME’s new volatility controls (daily price limits of 12% on copper) remain in effect to prevent disorderly moves[110]. Margin requirements have been adjusted periodically – for instance, CME raised margins on precious metals during volatile swings (copper margins can be hiked similarly if needed)[111]. Thus far, copper’s rise has been gradual enough to avoid major margin shocks, but any sudden spike could prompt exchanges to raise initial margins, which might cool speculative froth. Overall, financial regulation is more of a background factor; the main regulatory impacts on copper right now stem from trade policy and resource nationalism rather than trading rules.
Monetary Policy Influence: Central bank policies significantly influence industrial metals through interest rates, currency values, and economic growth. As noted, the U.S. Federal Reserve began cutting rates in December 2025 (25 bps) and is expected to ease by perhaps 50 bps through 2026[19]. This pivot to a more accommodative stance has boosted investor appetite for commodities like copper by reducing the opportunity cost of holding non-yielding assets and by supporting growth-sensitive sectors. Historically, copper tends to do well when the Fed is easing, as liquidity flows into hard assets and the economy (especially construction and manufacturing) gets a fillip. That pattern seems to be repeating: the mere expectation of Fed rate cuts in late 2025 helped fuel the copper rally[112][113]. Additionally, lower U.S. rates have weakened the dollar index from its 2022 highs, which bolsters dollar-priced copper demand globally[19]. On the other hand, if inflation surprises on the upside or the Fed slows its easing, it could strengthen the dollar and temper some of copper’s gains. Outside the U.S., China’s central bank (PBoC) has been in easing mode as well – it cut key interest rates and released liquidity in 2023–2025 to counteract its slowing economy. Chinese authorities have also rolled out targeted stimulus (such as easing property financing curbs, accelerating infrastructure project approvals, and even a rare cut to mortgage rates). If China steps up monetary or fiscal stimulus in 2026 to ensure its growth target (~5%) is met, that would directly support copper demand (especially via infrastructure and grid spending). The European Central Bank and others are more peripheral for copper, but generally, the trend of global central banks moving from tightening to neutral/dovish is a supportive backdrop for base metals. One caveat: central banks also affect investor behavior – the ultra-low rate environment in the early 2020s led to commodity index buying; if real rates rise again materially (not expected near-term), that could draw capital out of commodities. In summary, central bank policy is currently a tailwind for copper, lowering financing costs for industry and weakening the dollar, though it remains important to monitor inflation and policy shifts that could alter this equation.
Geopolitical and Macro Factors
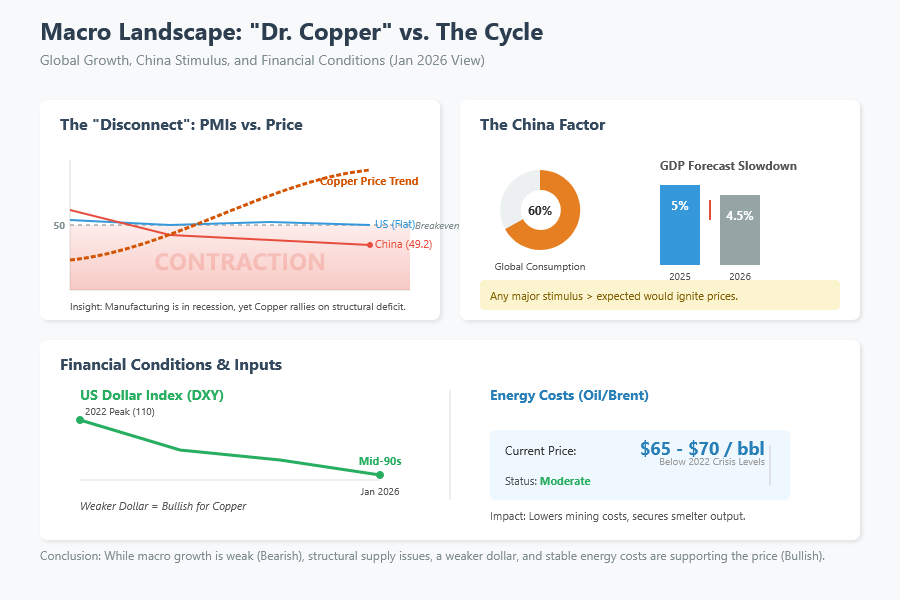
Global Economic Growth: Copper is famously sensitive to the macroeconomic cycle, earning it the nickname “Dr. Copper.” Global manufacturing activity in late 2025 was lukewarm – many major economies saw PMI indices around or below the 50 breakeven. For instance, China’s official Manufacturing PMI was 49.2 in Nov 2025 (eighth month of contraction)[78], indicating manufacturing recession, largely due to weak exports and property downturn. Europe’s manufacturing has been in decline amid high energy costs and slow demand. The U.S. manufacturing PMI has hovered near 50, showing flat industrial output. Normally, such conditions would weigh on copper, but the metal’s price strength is defying near-term macro softness due to structural factors. As we move into 2026, a key question is whether global growth re-accelerates or slips further. China’s growth and policy are paramount: China accounts for ~55–60% of world copper consumption[61]. Its GDP growth is forecast to slow from ~5% in 2025 to ~4.5% in 2026[77], with risks to the downside if the property sector doesn’t stabilize[77]. However, Beijing has signaled more support for the economy – for example, considering new stimulus for the property sector and pledging to boost domestic demand in 2026[114][115]. News of any significant Chinese stimulus (such as infrastructure spending packages or incentives for EV purchases) tends to lift copper prices. In fact, copper rallied 30%+ in 2025 partly on hopes of Chinese stimulus and despite only modest measures materializing[116]. If China were to roll out a larger-than-expected stimulus, it could surprise the upside for copper demand. Conversely, if China’s slowdown worsens (e.g. deeper property crisis, local government debt issues limiting investment), that is a top downside risk for copper.
U.S. and Europe: The U.S. economy has been relatively resilient, with infrastructure programs (the 2021 infrastructure bill, CHIPS Act, green energy investments) providing some copper demand underpinning. A mild U.S. recession is still a possibility in 2026 as higher interest rates from 2024 work with a lag – any broad downturn in the U.S. or a hard landing would dampen copper use in construction, autos, and durable goods. Europe’s demand is more stagnant, though “green deal” spending and grid upgrades offer some support. Global PMI indices will be closely watched; a synchronized upturn in manufacturing would further tighten the market, while a downturn would test whether supply tightness alone can keep prices elevated.
U.S. Dollar and Currency: As mentioned, the dollar’s trajectory is critical. The dollar index (DXY) spent much of 2025 in the high-90s, and currently trades in the mid-90s[19]. This is softer than the 2022 peak (~105–110) and has aided commodity prices. If the Fed eases and the U.S. economy slows, the dollar could weaken further, directly boosting copper’s appeal to non-U.S. buyers. On the other hand, any flare-up of global risk aversion might strengthen the dollar (as a safe haven), which could pressure copper. Emerging market currencies of key producers (Chile’s peso, Peru’s sol, etc.) also matter – a stronger local currency raises miners’ costs. Notably, Chile’s peso appreciated in late 2025 as copper prices climbed, but miners largely benefited from the high USD copper price outweighing FX. We will monitor currency moves as part of the macro mosaic.
Energy Prices: Energy is a major cost input for copper mining and especially for smelting/refining. In 2022, high oil and gas prices squeezed miners and smelters, but by Jan 2026, energy prices have moderated – for example, Brent crude is around \$65–\$70/bbl[117], and natural gas prices (US and Europe) are well below 2022 crisis levels[117]. This moderation in energy costs helps miners maintain output and keeps smelter operating costs in check (important for refining). However, low energy costs can also encourage higher production, potentially alleviating supply tightness slightly. One geopolitical risk on this front is if energy prices spike again (due to conflict or supply cuts) – that could lead to mine disruptions (many mines in Chile and Peru rely on diesel power or grid electricity which could be strained) and raise production costs, possibly curtailing marginal output. For instance, European smelters were on the brink in 2022 when power prices exploded; now with lower power prices, their output is more secure. So, stable-to-lower energy costs are quietly helping on the supply side. Conversely, if oil were to rally sharply (say OPEC cuts or conflict in the Middle East escalates), it would increase mining costs and maybe freight, but also could slow global growth – a complex impact on copper (higher cost-push vs. lower demand).
Geopolitical Risks in Key Regions: Several top copper producing regions face geopolitical or social risks that could materially affect supply:
- Chile and Peru (Latin America): Together responsible for ~40% of mine supply, these countries have seen political changes and social unrest. Chile recently rewrote its constitution and considered higher mining royalties, causing uncertainty, but ultimately enacted a moderate royalty increase in 2024 that industry can absorb. The election of a more mining-friendly president (Kast) reduces the risk of onerous policies[118]. However, social license issues (community opposition, labor strikes as discussed) remain an ever-present risk. In Peru, political instability (with multiple presidents in recent years) can lead to inconsistent policies, though the current government is maintaining a pro-mining stance. Still, local community protests (often over environmental concerns or revenue sharing) have in the past shut down mines like Las Bambas and Cuajone for weeks. Any resurgence of such conflicts in 2026 would tighten supply further.
- DRC and Zambia (Africa): The DRC has rapidly grown as a copper producer (and cobalt co-producer). It faces challenges like infrastructure bottlenecks, corruption, and conflict in certain provinces. There is also resource nationalism sentiment; the DRC government had a dispute with China Molybdenum over the Tenke mine profits, but that was resolved in 2022. Elections in the DRC (scheduled for late 2023, possibly concluded by now) could influence the investment climate. If political instability increases, that might threaten mine expansions. Zambia has been relatively stable and is trying to attract investment to ramp up its copper output, though it’s contingent on debt restructuring and policy reforms.
- Indonesia: Grasberg’s issues aside, Indonesia’s government strongly desires more domestic processing. If the new on-site smelter at Grasberg (PT Freeport Indonesia) doesn’t meet deadlines, Jakarta might enforce export limits. Any restriction on Indonesia’s ~5% of global copper concentrate exports would pressure smelters in Japan, China, etc., and ripple to refined supply.
- Others: The Russia-Ukraine war has indirectly affected copper by disrupting energy markets and certain metal flows. While copper itself from Russia hasn’t been broadly sanctioned, some Russian copper was shunned by buyers. This wasn’t a huge factor since Russia is a smaller producer (~3-4% of refined supply), but LME did see some self-sanctioning of Russian brands. The Middle East is not a copper production center, but conflict there can affect investor risk appetite and energy, as discussed. Finally, U.S.-China trade tensions always loom; so far, tariffs on copper between the two are not front-and-center (China mainly imports copper from others, and the U.S. imports little from China), but broader economic war or decoupling could influence demand patterns (for instance, if decoupling slows global growth or tech development, that could hit copper use in electronics).
The geopolitical landscape provides as many upside risks (supply disruptions) as downside (demand slowdowns). The market is finely poised, with any major event in a top producer country having the potential to jolt prices. At the same time, macro improvements (like stronger growth or stimulus) could quickly juice demand in this tight market. Thus, copper traders are watching everything from Fed speeches and Chinese PMI data to Chilean labor negotiations and Congolese export statistics in order to gauge the next move.
Outlook and Risk Scenarios
Short-Term Outlook (Q1 2026): The consensus among industry analysts is that copper will remain well-supported at current high price levels through at least the first quarter of 2026. Goldman Sachs, for example, expects prices to “remain supported at \$13,000 in the first quarter” given the present tightness[1][119]. J.P. Morgan’s Global Research team similarly forecasts averages around \$12,500/t in Q2 2026 amid supply deficits[63]. In fact, several banks have recently raised their near-term targets: Citigroup sees copper potentially exceeding \$13,000/t and even approaching \$15,000/t in 2026 under a bullish scenario of persistent shortages[13]. Market sentiment is clearly bullish for the coming months – the combination of low inventories, strong demand from energy transition sectors, and a favorable macro (rate cuts, dollar weakness) suggests prices will stay elevated. Many market participants even believe the speculative peak may lie ahead in the next few months if trend followers pile in; speculative positioning is high but could go higher before hitting historical limits[21][120]. That said, the current all-time high near \$13,300/t will act as an immediate resistance – a sustained break above that would likely require fresh catalysts (or a weaker dollar). Technical momentum remains on copper’s side for now, and dips have been shallow due to eager buying interest.
Full-Year 2026 Forecasts: Looking further out, forecasts diverge on how copper will finish 2026. A majority of analysts anticipate that prices may soften in the second half of the year, after a strong first half. For instance, Goldman’s base case forecasts a pullback to around \$11,000/t by end-2026 as some of the current tightness is resolved[119][82]. Their view is that once the U.S. tariff question is settled (by mid-2026) and if stockpiling abates, the market will refocus on what they project as a “large global surplus” in the coming year[98][83] – essentially arguing that current prices aren’t sustainable long-term. In line with this, Fitch Solutions (BMI) forecasts an average of \$11,000/t for 2026, which, though bullish historically, is below current spot[121]. Similarly, Bank of America is around \$5.13/lb (≈\$11,300/t) average[122], and TD Cowen recently lifted its 2026 forecast to \$5.25/lb (~\$11,600/t)[122]. These imply an expectation that prices will moderate later in the year, but stay high relative to past years. On the more bullish end, Citi’s scenario of \$5.90+ per pound by Q2 suggests not everyone sees a H2 downturn[122]. Indeed, if deficits persist, some foresee prices holding near records or even making new highs before sufficient new supply comes online. One data point: Goldman noted that even with supply concerns, they actually expect only a “small market surplus for 2026” and no fundamental shortage until 2029 in their models[123][124]. This somewhat contradicts the deficit narrative, illustrating the uncertainty – it might be that apparent surplus vs effective availability will continue to differ (just like 2025). Overall, the median outlook sees copper averaging roughly \$4.80–\$5.20/lb (≈\$10,600–\$11,500/t) for 2026[122], which is lower than current prices, implying some mean reversion as markets rebalance. However, virtually all analysts agree the structural trend is upward in the longer term, given the expected demand surge this decade versus limited new supply.
Upside Potential (Bullish Scenario): In a bullish scenario, copper could extend well beyond current highs, fueled by a combination of strong demand and supply hiccups. Key upside catalysts include:
- Further Supply Disruptions: The market is pricing in some mine recovery for 2026. If instead we see more bad news – e.g., a major mine accident, prolonged strikes at big mines, or a delay in a major project – it could quickly remove tens of thousands of tonnes from expected supply. As an example, the strike at Mantoverde, Chile (Capstone) shows how even mid-sized mines halting can tighten the market[102]. If something similar happened at a top-5 mine (like Escondida or Collahuasi in Chile, or Grasberg if issues recur), the impact on price could be dramatic, potentially pushing copper to fresh records above \$15,000/t in a panic buying response.
- Chinese Demand Surprise: While baseline forecasts have China slowing, a more aggressive stimulus from Beijing could swing sentiment. If China were to, say, roll out a large infrastructure package, prop up housing construction more forcefully, or continue cutting interest rates, it might reignite its materials demand. A scenario where China’s property market stabilizes and EV/renewables growth exceeds expectations would tighten the market further. There’s also a possibility of inventory restocking in China – Chinese consumers drew down some stocks in 2024–25; if they decide to rebuild inventories at these high prices, it would signal extremely strong demand conviction.
- Inventory Drawdowns/Shocks: We’ve discussed how low inventories are, but an outright inventory “shock” could occur if, for instance, a large proportion of remaining LME stocks gets canceled and withdrawn quickly. If freely available LME copper were to drop back toward, say, 50,000t or lower (as it did mid-2025) without immediate replacement, it could cause wild backwardation and price spikes. Any hint of that (e.g., one player warranting up a lot of stock) might spook the market into bidding up spot prices sharply.
- Speculative Momentum: Copper’s narrative as a critical energy transition metal might increasingly attract general investors and funds (not just commodity specialists). Already we saw institutions rotating from precious into copper in late 2025[17][18]. If momentum traders or trend-following algorithms continue to jump in, their buying could overshoot fundamentals. With futures positioning at record longs but not at limit, a speculative blow-off rally above \$6.50/lb is conceivable before any correction[21].
- Macroeconomic Tailwinds: A scenario of a “soft landing” or global growth reacceleration in 2026 would boost cyclical demand. For instance, if the U.S. avoids recession and Europe recovers a bit, while emerging markets grow steadily, baseline demand might surprise to the upside. Also, a continued slide in the U.S. dollar (if Fed cuts faster or other central banks stay hawkish) would mechanically lift copper’s dollar price.
In such a bull case, some analysts talk about copper approaching \$15,000/t (Citi even floated up to \$15k if shortages persist)[13]. Some even more aggressive projections from industry bulls or trading houses suggest that if the deficit becomes severe, copper could temporarily reach levels like \$7–\$8/lb (which would be unprecedented). An extreme example: if the U.S. announced an immediate tariff and simultaneously a major mine went offline, the scramble could create a squeeze of historic proportions. While not the base case, these upside risks mean consumers are wary – many end-users are trying to hedge or secure supply now rather than risk much higher prices later in the year.
Downside Risks (Bearish Scenario): Despite the bullish environment, there are notable risks that could send copper prices lower from current heights. Key downside factors include:
- Resolution of Trade/Tariff Issues: The biggest near-term bearish trigger would be a resolution of the U.S. tariff uncertainty that removes the incentive for stockpiling. If by mid-2026 it appears the 15% tariff on refined copper will not be implemented (or will be delayed significantly), the huge U.S. inventories could start unwinding[100]. Holders of COMEX stocks might begin re-exporting or selling into the domestic market, effectively increasing available supply globally. Goldman Sachs explicitly warns that if the tariff announcement is delayed or dropped, the market could suddenly focus on the “well-supplied” condition (with all that copper sitting in the U.S.) and prices could fall accordingly[125][126]. In essence, the artificial tightness outside the US would be relieved as metal flows normalize.
- Rebound in Mine Supply: The flip side of disruptions is better-than-expected supply. Some mines that struggled in 2025 could over-deliver in 2026. For example, Freeport’s Grasberg might not only recover from 2025 woes but produce above plan if the new underground sections hit stride. Similarly, Chile could surprise if efficiency gains or debottlenecking at major mines occur (the Chilean Mining Council did suggest small/medium mines could ramp up output quicker than large ones[127]). New projects or expansions coming online (Ivanhoe’s Phase 3 at Kamoa, Teck’s QB2 reaching capacity, etc.) might collectively add more supply than anticipated. If global mine output growth exceeds, say, 4–5% (versus the ~3% expected), it could swing the refined balance back toward surplus, especially by late 2026.
- Scrap and Substitution Response: High prices tend to catalyze two market responses: scrap supply increases and demand substitution. We already see scrap rising – if copper stays around \$6/lb, nearly all available scrap will make its way to market as it becomes highly profitable to recycle. This could satisfy more of the demand, reducing the need for refined cathode. On the substitution front, prolonged high copper prices may push manufacturers to seek alternatives where possible. For instance, aluminum is a substitute in some electrical applications (though not one-to-one equal, as conductivity differs). If copper remains extremely expensive, we could see accelerated development of copper-alloy or aluminum wiring for certain uses (e.g., in building wire, some automakers might use more aluminum in cabling if feasible). Another area is using fiber optics instead of copper cables in telecom (already happening to a degree). While such substitutions won’t crash copper demand overnight, they can erode the growth in certain sectors if price stays punitive.
- Macro/Economic Slowdown: A significant global economic downturn would hit copper demand hard. If, for example, the U.S. falls into a recession in mid-2026 and China’s growth slips further, the aggregate demand for copper in construction, autos, consumer goods, and machinery would weaken. Given copper’s run-up has partly priced in future demand, a recession could prompt a sharp correction as demand forecasts are revised down. Also, industrial metal prices can drop quickly if investors shift to risk-off mode (which typically strengthens the dollar and reduces commodity investment). In a scenario of global GDP growth falling well below expectations (say <2%), copper could retreat toward marginal cost levels until balance is restored.
- Speculative Position Unwind: With speculative longs near record highs, the market is vulnerable to a swift pullback if sentiment changes. Any catalyst that flips sentiment – be it a hawkish Fed surprise, disappointing Chinese stimulus, or even just technical selling – could lead to a cascading sell-off as long positions are liquidated. The Argus analysis notes that despite bullish views, many participants are cautious that “not every signal points to higher prices” and that ample U.S. stocks could dampen gains if sentiment shifts[128][129]. If a wave of profit-taking starts, copper’s volatility means prices could easily drop 10-20% in a short span (recall that in July 2025, prices fell $1.24/lb in one day after a tariff decision[3][4]).
- Resolution of Mine Disputes: Some supply threats may resolve positively – e.g., the strike at Mantoverde could end with a deal, restoring that output. More broadly, if producers manage to negotiate labor contracts without major stoppages this year (perhaps learning from current high stakes), the market might avoid some disruption that is currently feared. Additionally, if governments in top countries take action to facilitate more copper output (for example, faster permit approvals in Chile as promised, or Peru providing security for transport so blockades don’t recur), these would be fundamentally bearish developments adding supply or at least confidence in supply.
Taking these into account, a plausible bearish scenario could see copper retreat to the \$8,000–\$9,000/t range (≈\$3.60–\$4.10/lb) if multiple factors align – say, U.S. tariffs are shelved (releasing stocks), mines come back strongly, and global demand disappoints. That would still be a high price historically, but much lower than recent peaks. It’s worth noting that even Goldman’s relatively bearish end-2026 forecast (\$11,000/t) is only about 18% below today’s price[130]. So the downside, as currently conceived by many forecasters, is somewhat limited unless a true sea-change in fundamentals occurs.
Conclusion: As of January 2026, the global copper market finds itself in a rarefied environment of record prices and intense tightness, driven by the dual forces of constrained supply and surging strategic demand. We have a market in which near-term fundamentals are extremely supportive – exchange inventories outside the U.S. are at precarious lows, mine output is just recovering from setbacks, and usage in electrification sectors is climbing relentlessly. Layered on top are idiosyncratic factors like U.S. trade policy and investor rotation, which have added fuel to the rally. In the coming months, copper is expected to trade firmly, with \$6 per pound now a realistic trading level and the potential for spikes if any new shock hits. Most analysts caution, however, that today’s lofty prices may not be sustained indefinitely. By late 2026, either some relief on the supply side (mine and scrap increases, or tariff-driven reallocation) or a cooling of demand could gradually ease the strain, possibly pulling prices off their peaks. The market’s fate will likely hinge on the outcome of the U.S. tariff decision mid-year and on China’s economic performance – these are the pivot points that could either prolong the deficit or flip the narrative toward surplus.
For now, producers and consumers alike are navigating a high-price environment: miners are enjoying windfall revenues (though grappling with restive labor and resource taxes), while manufacturers face high input costs and are seeking ways to adapt (through hedging, thrifting, or passing costs on). End-users in critical industries (electric grid, EVs) are watching copper closely, as its availability and price could even influence project timelines or technology choices. Given copper’s vital role in the energy transition, many stakeholders are hoping for a “tolerable” price – high enough to incentivize new supply, but not so high as to derail demand growth.
Outlook: In January 2026, the bias for copper prices remains to the upside in the short term, with tight supply-demand fundamentals supporting elevated levels[85]. Our view is cautiously bullish through the first half: we anticipate LME copper prices to trade in the \$12,000–\$13,500 per tonne range (\$5.45–\$6.15/lb) for Q1, potentially testing new highs if any supply glitch occurs. As the year progresses, the probability of some retracement grows – if the U.S. tariff decision in June removes a key bullish pillar, we could see prices ease into H2, perhaps moving back toward \$10,000–\$11,000/t by year-end (though still above pre-2025 norms)[130]. This would align with a market gradually shifting from deficit to balance/surplus as latent inventory is released and mine output improves. However, such an easing is far from guaranteed; a failure to solve supply-side issues or an acceleration of demand would keep the market tight all year. Thus, risks remain skewed in both directions: upside risks from supply disruption and underinvestment, and downside risks from policy resolutions and macro weakness.
Stakeholders should prepare for continued high volatility – the copper market in 2026 is likely to see rapid moves on headlines, as evidenced by the dramatic spread swings in January[7]. Active risk management (through hedging or flexible contracts) is prudent for consumers, and producers may consider locking in some of these favorable prices given historically unprecedented levels. In any event, copper’s strategic importance means it will stay in the spotlight. If 2025 was the year copper broke out to new highs, 2026 will be the year that tests whether those highs are justified and sustainable. Based on the information at hand – low inventories, strong secular demand, and cautious supply growth – the base case outlook is that copper will remain elevated and well-supported in the near term, with a moderate cooling possible later in the year as certain constraints unwind. “Dr. Copper” is sending a clear message: the long-term energy transition story is bullish, but the path will be volatile, with policy and macro swings making for a bumpy ride. Stakeholders should remain vigilant, as the copper market’s complex interplay of fundamentals and politics promises an eventful 2026.
Sources: London Metal Exchange, CME/COMEX settlement price data; LME, COMEX, SHFE inventory reports; J.P. Morgan and Citigroup 2026 forecasts[63][13]; Goldman Sachs Global Metals Outlook[131][82]; Reuters and Bloomberg news on TC/RC settlements and mine disruptions[51][53]; ICSG Copper Bulletin January 2026[61][62]; Fitch Solutions (BMI) copper outlook[121][59]; Recycling Today scrap market commentary[29][66]; Bloomberg/Argus market commentary on U.S. tariffs and spreads[30][132]; Bloomberg News on Chile policy and labor strikes[90][102]; and other commodity analysis as cited above.
- Goldman Sachs — Why Record-High Copper Prices Aren’t Forecast to Last [1, 21, 81, 82, 83, 84, 98, 99, 101, 119, 120, 125, 126, 130, 131]
- Investing.com — Copper Outlook 2026 [2, 11, 12, 13, 16, 17, 18, 63, 85]
- Argus Media — US Copper Faces Uncertain 2026 Outlook [3, 4, 30, 32, 34, 44, 45, 74, 75, 122, 123, 124, 128, 129, 132]
- Trading Economics — Copper Price Data [5]
- The Edge Malaysia — Copper Nears US$13,000 [6, 7, 10, 20, 40, 41, 42]
- Reuters — LME’s New Position Rules [8, 9, 22, 23, 24, 25, 28, 33, 36, 37, 38, 47, 48, 94]
- Investing.com — Copper Breaks Records as Backwardation Builds [14, 15, 26, 27, 49, 50, 112, 113]
- Discovery Alert — Copper Price Forecast 2026 [19, 31, 35, 43, 59, 60, 64, 65, 70, 71, 72, 73, 77, 78, 79, 86, 97, 100, 121]
- Recycling Today — Nonferrous Markets 2026 [29, 66, 67, 68, 95, 96]
- Westmetall — LME Copper Cash & Stocks [39]
- Fastmarkets — Copper Spread Backwardation Narrows [46]
- MINING.com — Antofagasta Zero Processing Charges [51, 52, 53, 54]
- ScrapMonster — ICSG Copper Market Report [55, 56, 57, 58, 61, 62, 80]
- S&P Global — Copper Supply Shortfall Study [69]
- Crux Investor — China Stimulus & Copper [76]
- MINING.com — Chile Copper Supply Gains Seen Years Away [87, 88, 89, 90, 91, 92, 93, 117, 118, 127]
- MINING.com — Capstone Chile Mine Disruption [102, 103, 104, 105]
- Farmonaut — Copper Mine Disruptions 2025 [106]
- Bloomberg — Commodity Index 2026 Target Weights [107, 109]
- Economic Times — BCOM Rebalancing & Copper [108]
- London Metal Exchange — Volatility Controls [110]
- MINING.com — CME Margin Methodology Change [111]
- Bloomberg — Metals Climb on China Stimulus [114]
- Evrim Ağacı — China Drives Global Copper Boom [115]
- Finimize — Copper Climbs as China Eyes Support [116]