May 3, 2026
Nasdaq-100 Futures Analytical Report
Executive Summary
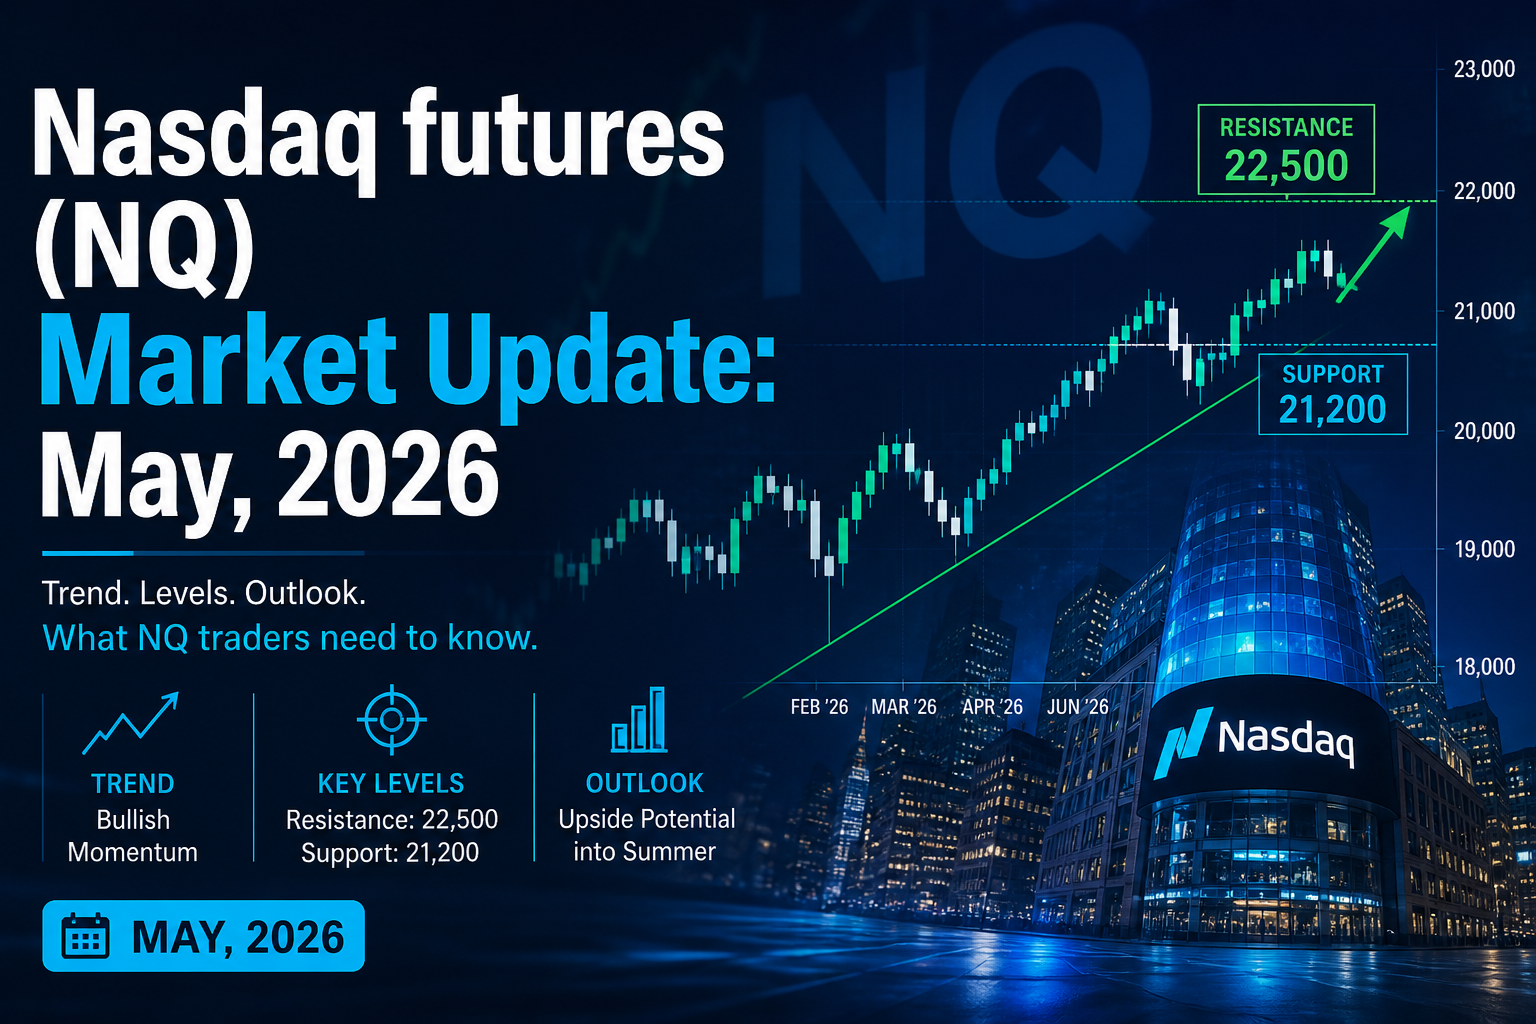
Looking at NQ daily OHLC data series through Apr. 30, NQ moved from a late-March washout into a clear bullish trend, not a range-bound market: the contract reversed from a Mar. 31 low at 22,961.5, broke out decisively on Apr. 8, and finished Apr. 30 at a new monthly high of 27,596.0, a 14.5% net gain across the supplied sample and a 20.3% swing from the Mar. 31 low to the Apr. 30 high. The main external drivers were a Middle East ceasefire-driven relief move, resilient macro prints from the U.S. Bureau of Labor Statistics[1], an Apr. 29 hold from the Federal Reserve[2], and mixed but still growth-supportive hyperscaler earnings from Alphabet[3], Amazon[4], Microsoft[5], and Meta Platforms[6]. Reuters also noted that the Nasdaq logged its strongest April since 2020, confirming leadership rather than a generic beta rebound. [7]
Tactically, the trend is still bullish but stretched. The immediate question is whether NQ can accept above 27,623 and extend toward 27,900-28,000, or whether overbought momentum and event-driven profit-taking force a retest of 27,100 and then 26,635-26,825. A trader’s map is simple: above 27,623 = continuation, below 27,000 = first warning, below 26,635 = trend damage.
Trend and Structure
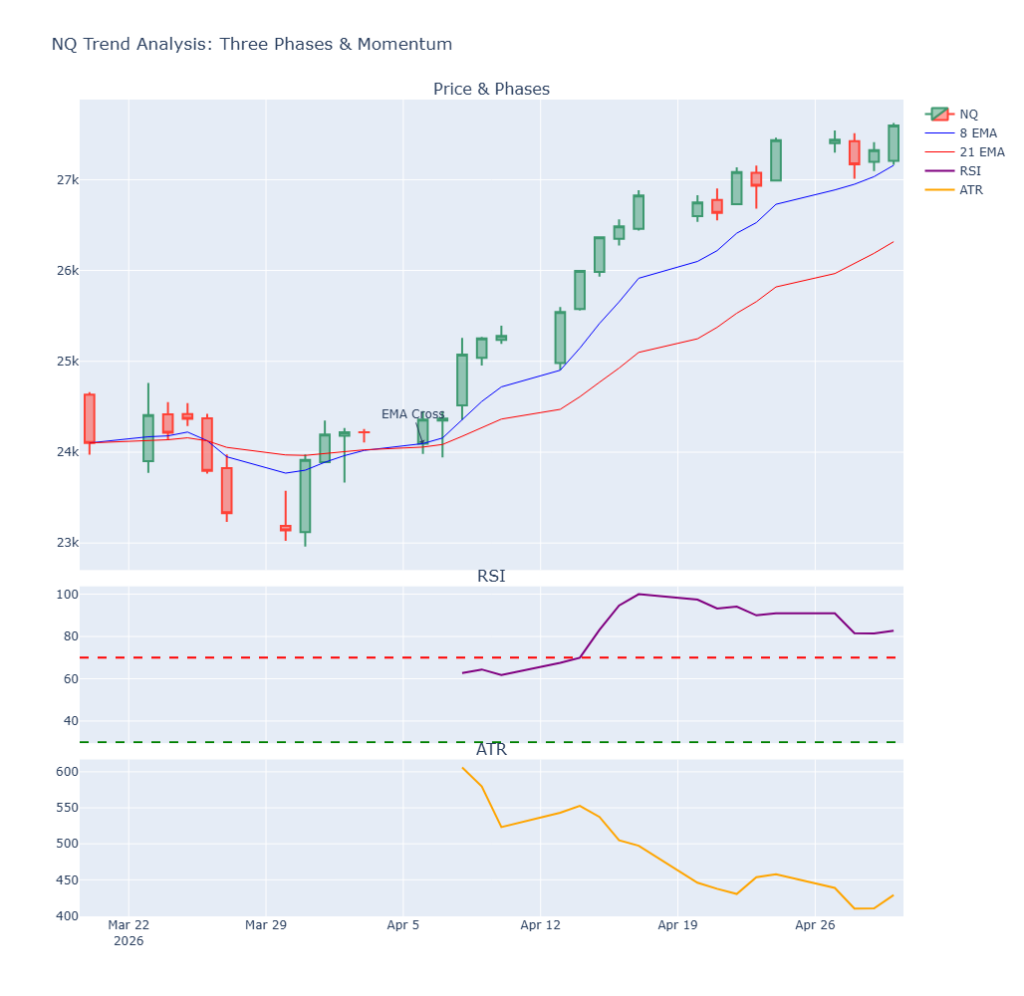
The daily structure changed in three phases. First, NQ sold off into Mar. 30, then posted a high-volume reversal on Mar. 31. Second, it spent Apr. 1-7 building a base in roughly the 23,900-24,450 area. Third, it exploded higher on Apr. 8 and never truly lost trend control afterward. The cleanest technical signal was the 8-day EMA crossing back above the 21-day EMA on Apr. 6, just ahead of the Apr. 8 expansion day. After the breakout, pullbacks were shallow and short-lived, especially on Apr. 20-21 and Apr. 28.
The momentum profile stayed unusually strong. RSI(14) pushed above 70 on Apr. 9 and ended Apr. 30 at 80.9, which is overbought but also typical of persistent trend phases. ATR(14) peaked around 606 on Apr. 8, then compressed toward 410 by Apr. 28 before ticking back up to 429 on Apr. 30, a pattern consistent with a breakout that matures into orderly trend continuation rather than panic volatility.
For the intraday lens, the supplied sample is daily-bar data, so the 1H/4H view below is an execution framework built from the most recent swing structure rather than a separate intraday feed. On that basis, the market has been trading like a buy-the-dip trend since Apr. 8, with the most important intraday battleground now centered on 27,000-27,325.
Key Levels
The levels below are the ones that matter most for execution over the next few sessions.
| Zone | Timeframe | Why it matters | Read |
|---|---|---|---|
| 27,620-27,650 | Daily breakout resistance | Apr. 30 high / immediate trigger | Acceptance above it favors continuation. |
| 27,900-28,000 | 1H/4H upside objective | Measured extension + round-number magnet | First upside target if highs give way cleanly. |
| 27,300-27,440 | 1H/4H support | Recent close cluster and nearest pullback shelf | First support on shallow dip-buying. |
| 27,000-27,100 | 4H / daily | Apr. 22 breakout shelf + round number | Must-hold for the bullish near-term script. |
| 26,635-26,825 | 4H / daily | Apr. 17-21 consolidation floor | Loss of this zone weakens trend quality materially. |
| 26,520 / 26,207 | Daily | 23.6% retrace of Mar. 31-Apr. 30 leg / 20D SMA | Next higher-timeframe support if 27k fails. |
| 25,250-25,400 | Daily swing | Apr. 8-10 breakout base / 50% retrace | Major pullback support, not first support. |
| 24,740-24,900 | Daily swing | 61.8% retrace / Apr. 13 swing-low area | Last key support before the Apr. breakout is fully questioned. |
The moving-average backdrop remains constructive: on Apr. 30 the 10-day SMA was 27,119, the 20-day SMA was 26,207, the 8-day EMA was 27,158, and the 21-day EMA was 26,317. Price is comfortably above all of them, so the trend is still intact unless the market starts closing back under the short stack first and the 20-day afterward.
Events That Moved NQ
The month’s rally was built on a sequence of catalyst shifts: early concern about war-and-oil inflation, then ceasefire relief, then confirmation that macro data were firm enough to avoid recession panic but not weak enough to force immediate easing, and finally a hyperscaler earnings week that rewarded visible AI monetization more than abstract AI spending. [8]
| Date | Event | NQ reaction |
|---|---|---|
| Apr. 3 | March payrolls rose 178,000 and unemployment held near 4.3%, a stronger labor read that kept the Fed on hold rather than pushing toward rapid easing. [9] | Muted / flat session in the supplied data, with unusually light volume. |
| Apr. 8 | A two-week Middle East ceasefire headline triggered a broad relief rally; Reuters reported the Nasdaq rose 2.8% and crude fell more than 13%. [10] | +2.9%, wide-range breakout, major character change. |
| Apr. 10 | March CPI showed 3.3% y/y headline and 2.6% y/y core, with Reuters describing the outcome as calming some inflation concerns. [11] | NQ held gains and stayed above the breakout zone. |
| Apr. 15 | Reuters tied the next leg higher to earnings optimism and renewed hopes for diplomatic progress; the Nasdaq pushed to records. [12] | +1.4%, continuation move through 26,000. |
| Apr. 23-24 | Reuters reported investors were rotating back into U.S. stocks as AI spending and earnings growth re-accelerated risk appetite. [13] | Breakout extension toward 27,400+. |
| Apr. 28 | Reuters said Nasdaq and S&P fell on renewed AI-growth worries ahead of hyperscaler earnings, with chip names hit hardest. [14] | -1.0%, the cleanest late-month pullback, but 27,000 still held. |
| Apr. 29 | The Fed held rates at 3.5%-3.75% and noted elevated inflation tied partly to energy, while Reuters described the vote as the most divided since 1992; attention then shifted to four major tech earnings releases after the close. [15] | Choppy but resilient: +0.6%, with trend support preserved. |
| Apr. 30 | The U.S. Bureau of Economic Analysis[16] reported Q1 GDP +2.0%. Reuters said the market also looked through mixed hyperscaler reactions as Alphabet’s cloud strength and solid earnings helped offset capex anxiety elsewhere. [17] | +1.0% to a new monthly high, with a volume spike. |
The late-month earnings mix mattered. Amazon reported net sales +17% and AWS +28%; Microsoft reported revenue +18%; Meta delivered strong revenue growth but lifted 2026 capex to $125B-$145B; Reuters said Alphabet’s record cloud quarter was the clearest evidence of near-term AI monetization, which is why Alphabet was rewarded more cleanly than Meta and Microsoft. [18]
Signals Traders Should Watch
The most important bullish continuation signals are straightforward. First, 27,000-27,100 must keep acting as support; that is the nearest shelf where buyers have shown up repeatedly. Second, dips should remain shallow relative to the 10-day SMA at 27,119 and especially the 20-day SMA at 26,207. Third, upside breaks need volume confirmation; the cleanest examples this month were Mar. 31, Apr. 8, and Apr. 30, all of which printed materially above the recent volume norm. Fourth, the relative-strength backdrop is still healthy: the Nasdaq remained the leadership index through April, with Reuters calling out its best month since 2020. [19]
The main reversal / risk-off warnings are also clear. A failed breakout above 27,623 followed by a close back under 27,300, and then especially under 27,000, would turn the tape from “trend continuation” into “bullish exhaustion.” If that happens, the first meaningful downside target is 26,635-26,825, followed by 26,520/26,207. A daily close through that second zone would argue for a deeper mean reversion into the 25,250-25,400 breakout base.
On indicators, the message is: trend strong, but stretched. RSI > 80 means shorting blindly is lower-quality unless price also loses structure. ATR compression from the Apr. 8 surge into late April means the market had become more orderly; a fresh ATR expansion now would matter because it will tell traders whether the next move is a breakout continuation or the start of a deeper unwind. Right now there is no confirmed bearish divergence in the supplied data.
Tactical Takeaway
The base case remains bullish continuation with selective dip-buying, not broad mean reversion. The cleanest long setup is either acceptance above 27,623 for a push toward 27,900-28,000, or a controlled pullback that holds 27,100 and reclaims momentum. The tape turns more neutral below 27,000, and more defensively tactical below 26,635. In practical terms: do not confuse “overbought” with “bearish” until price actually loses structure.
- Federal Reserve Press Release (April 29, 2026)
- Reuters: Wall Street Futures Hold Steady (April 15, 2026)
- Reuters: Investors Return to U.S. Stocks (April 23, 2026)
- Bureau of Labor Statistics Employment Situation Report
- Reuters: Futures Mixed as Oil Spike (April 30, 2026)
- Reuters: Futures Jump on Ceasefire Relief (April 8, 2026)
- BLS Consumer Price Index (April 10, 2026)
- Reuters: Futures Fall Amid Oil Risk Concerns (April 28, 2026)
- BEA GDP Advance Estimate (Q1 2026)
- Amazon Q1 2026 Earnings Release