July 22, 2026
The Best and Worst Times to Trade Nasdaq Futures
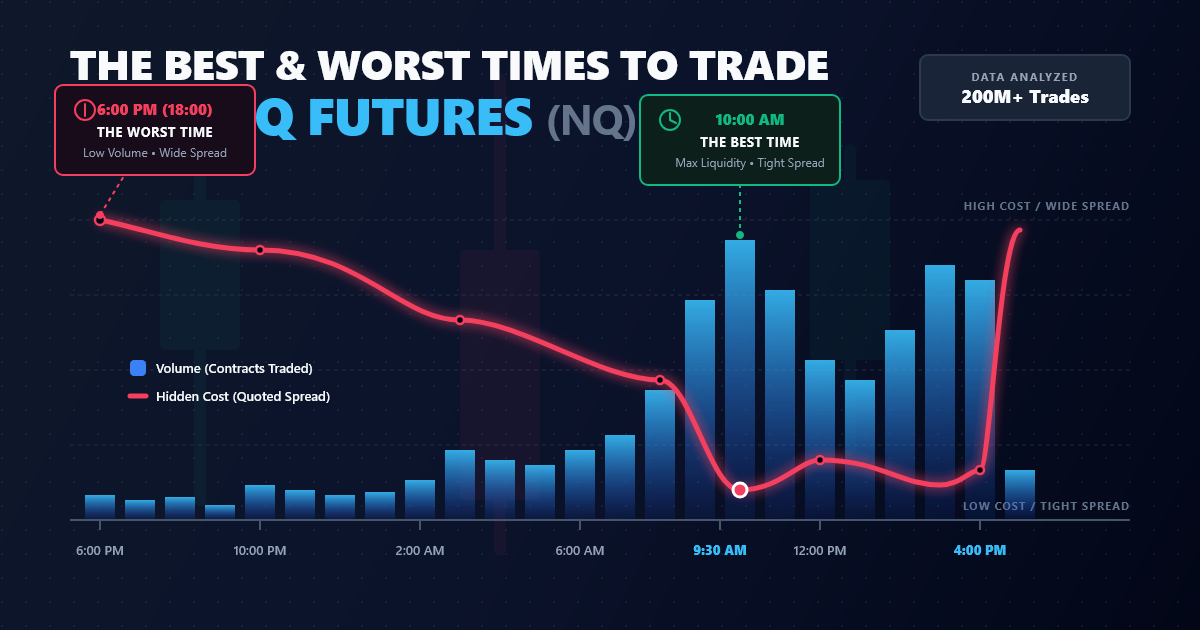
The same Nasdaq futures setup can be inexpensive to execute at 10:00 a.m. and surprisingly costly at 6:00 p.m. The chart may look equally tradable in both cases, but the market underneath it is different: fewer contracts are changing hands, the quoted spread is wider, and a larger share of the available movement can disappear before the trade has a chance to work.
That is the hidden cost of trading NQ at the wrong time.
To measure it, I analyzed nearly 200 million trade records across 414 NQ sessions, from December 12, 2024 through July 21, 2026. The data came from Sierra Chart intraday files and used one active front-month contract per session. All times in this article are Eastern Time.
The result is not one universal “best hour.” The best time depends on whether a trader needs liquidity, movement, calm execution, or some combination of the three.
The short answer
For most discretionary NQ traders, the useful part of the day is concentrated between 9:00 a.m. and 4:00 p.m. ET. Liquidity is highest during the U.S. cash session, spreads are generally narrower, and quoted execution cost consumes a smaller percentage of the market’s hourly range.
But beginners should not confuse liquidity with ease. The 9:00–11:00 a.m. window offers the most movement and volume, yet it also has the greatest short-term price-change risk. It is efficient, but fast.
The quiet overnight hours present the opposite problem. Prices move more slowly, but volume is thin and the spread consumes more of the available range. The reopening hour beginning at 6:00 p.m. was the clearest example: its average trade-time spread reached 5.51 NQ ticks, versus roughly 2.3–2.4 ticks during much of the afternoon cash session.
Here are the most useful comparisons:
| Hour beginning ET | Median hourly range | Average volume | Average spread | 75th-percentile 5-sec midpoint move | Quoted NQ round trip* |
|---|---|---|---|---|---|
| 9:00 a.m. | 154.5 points | 74,249 | 2.81 ticks | 5.25 points | $14.06 |
| 10:00 a.m. | 149.9 points | 83,326 | 2.65 ticks | 4.25 points | $13.27 |
| 12:00 p.m. | 91.2 points | 46,800 | 2.33 ticks | 2.75 points | $11.65 |
| 3:00 p.m. | 92.1 points | 61,887 | 2.32 ticks | 3.06 points | $11.62 |
| 6:00 p.m. | 60.4 points | 6,860 | 5.51 ticks | 2.25 points | $27.53 |
| 11:00 p.m. | 32.0 points | 3,728 | 3.47 ticks | 1.25 points | $17.34 |
*One contract, before commissions and market impact. Entry and exit together cross one full quoted spread when benchmarked to the midpoint.
Average NQ range by hour
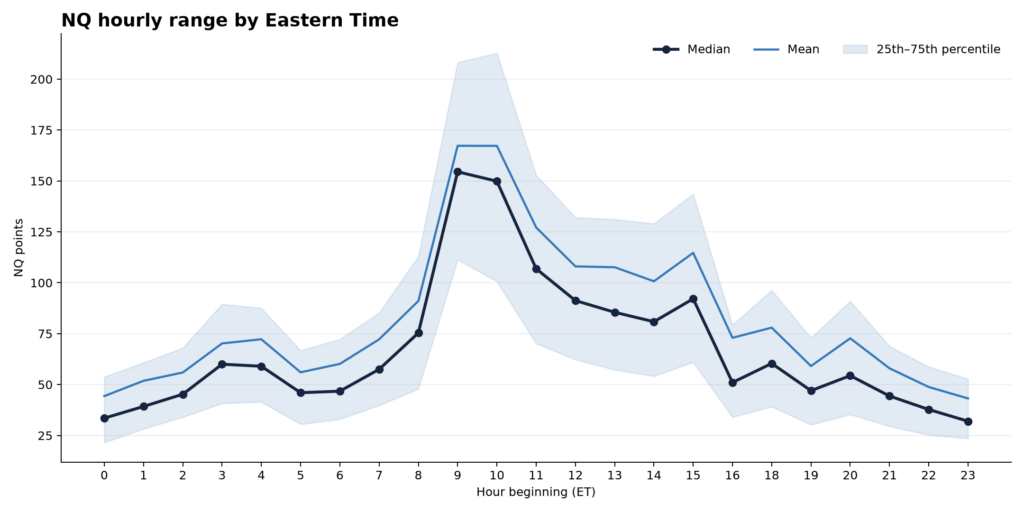
NQ’s hourly range follows a strong time-of-day pattern.
The median range jumps to 154.5 points during the 9:00 a.m. hour and remains near 149.9 points during the 10:00 a.m. hour. It then falls to 106.9 points at 11:00 a.m. and 91.2 points at noon. Activity increases again in the final hour of the cash session, with a 92.1-point median range beginning at 3:00 p.m.
Overnight, the market is much quieter. The median range was only 33.5 points beginning at midnight and 32 points beginning at 11:00 p.m.
This does not mean the morning is automatically more profitable. A larger range creates more opportunity, but it also creates faster losses, more stop movement, and greater sensitivity to hesitation. Range tells us how much the market moved—not whether that movement was easy to capture.
The mean sits above the median during nearly every hour. That gap is important. A minority of exceptionally volatile sessions pulls the average upward, so the median is a more realistic description of an ordinary day.
Volume by hour
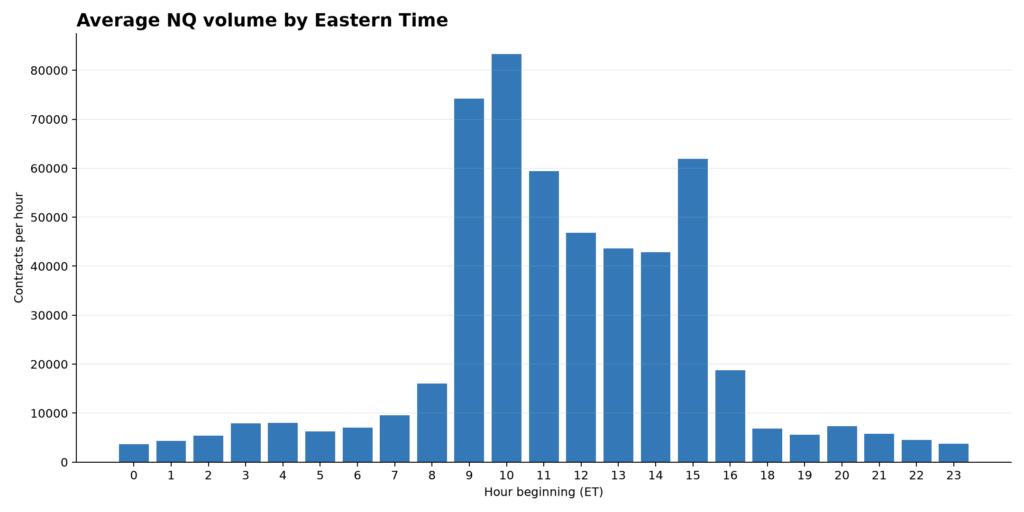
Volume is even more concentrated than range.
The highest average hourly volume occurred from 10:00–11:00 a.m., at approximately 83,326 contracts. The 9:00 a.m. hour averaged 74,249 contracts, while the 3:00 p.m. hour averaged 61,887.
Compare that with only 3,606 contracts beginning at midnight or 3,728 at 11:00 p.m. The 10:00 a.m. hour traded more than twenty times as many contracts as those quiet overnight periods.
High volume generally helps a trader in three ways:
- More orders are available to transact against.
- The spread tends to narrow.
- A single small order is less likely to represent a meaningful share of current activity.
Volume does not eliminate slippage, especially during a sudden repricing. It does, however, improve the basic conditions under which a small market order is executed.
How the NQ spread changes
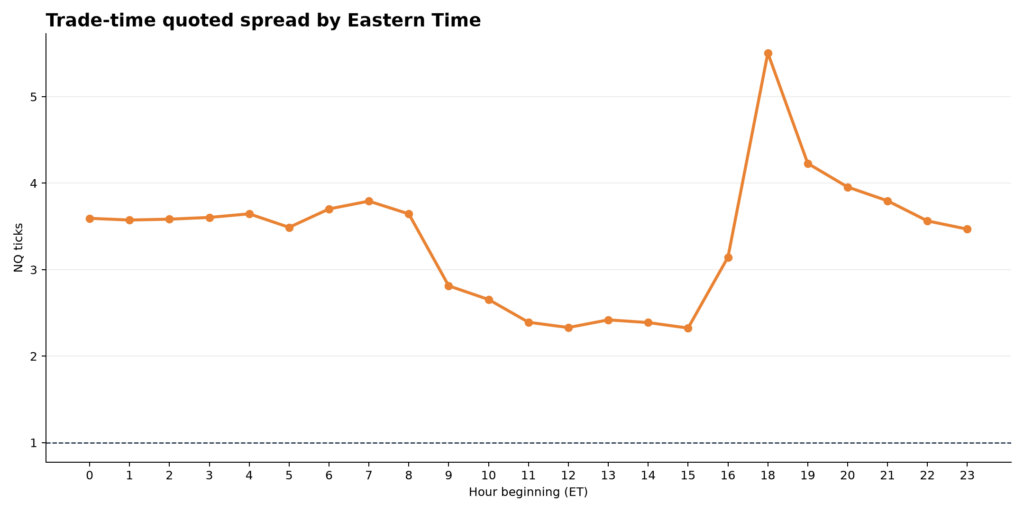
The spread result is one of the clearest reasons to care about time of day.
During the most liquid portion of the cash session, the average trade-time spread fell toward 2.3–2.7 ticks. It was lowest during the hour beginning at 3:00 p.m., at 2.32 ticks, followed closely by noon at 2.33 ticks.
At the 6:00 p.m. futures reopen, the average jumped to 5.51 ticks. It then declined through the evening but remained wider than the cash-session afternoon.
For one NQ contract, each tick is worth $5. A 2.32-tick quoted round trip therefore represents about $11.62 before commissions. Using the unrounded spread estimate, the 6:00 p.m. round trip represents about $27.53.
These figures are midpoint-benchmarked estimates, not a promise of what any specific order will receive. They also exclude commissions and additional price impact. A limit order may avoid crossing the spread but introduces a different cost: the possibility of not being filled, or being filled just before the market moves against it.
Slippage is more than the spread
Sierra’s trade records do not reveal an individual trader’s decision price, queue position, order size, or actual fill. Calling any historical estimate “observed slippage” would therefore overstate what the data can prove.
Instead, I measured a transparent slippage-risk proxy: how far the quoted midpoint moved 1, 5, and 15 seconds after each trade-time observation. The chart shows the median session’s 75th-percentile absolute movement.
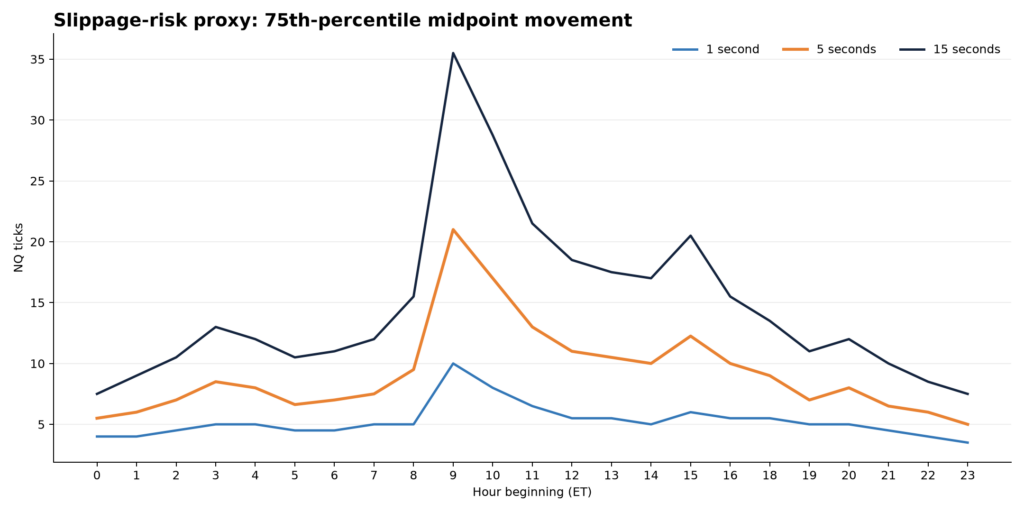
The 9:00 a.m. hour had the largest five-second movement: 5.25 points at the 75th percentile. At 10:00 a.m., the corresponding figure was 4.25 points. At noon it fell to 2.75 points, and at 11:00 p.m. it was 1.25 points.
This creates a crucial distinction:
- The morning has better liquidity and a narrower spread, but prices change faster.
- Overnight prices change more slowly, but the spread is wider and less volume is available.
A trader who hesitates after a morning signal may experience more price movement before entry. A trader who enters overnight may face less speed but pay more friction relative to the opportunity available.
The cost-to-range problem
An $18 round trip is not equally important in every environment. It matters less when the market’s median hourly range is 150 points than when the range is only 32 points.
To make the comparison fair, I divided the estimated quoted round-trip cost by the median hourly range.
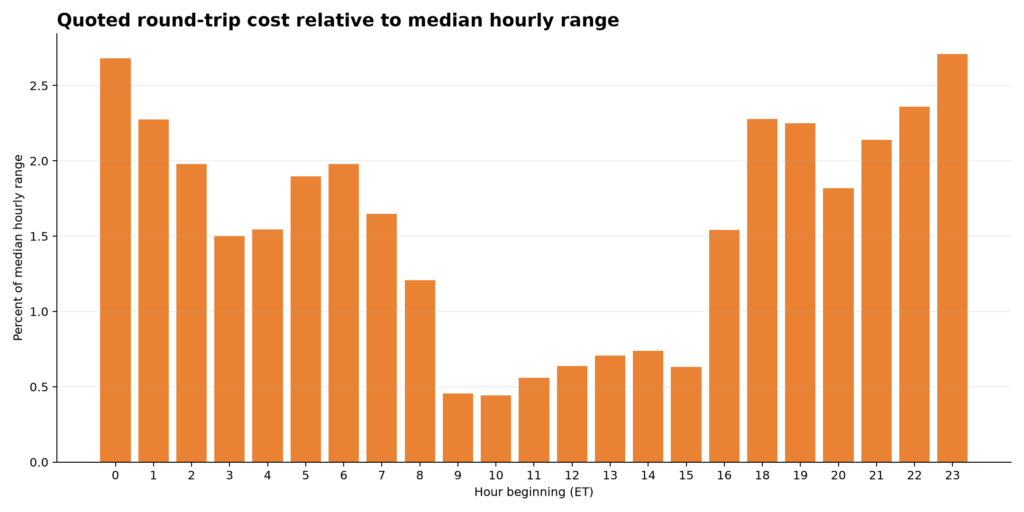
The lowest ratios occurred during the high-volume morning: approximately 0.44% at 10:00 a.m. and 0.46% at 9:00 a.m. The ratio increased to 2.68% at midnight and 2.71% at 11:00 p.m.
This ratio is not a backtest and does not represent the percentage of a trader’s target consumed by costs. Real strategies usually target only a fraction of the full hourly range. For a short-term scalper, the true cost burden can therefore be much larger.
The comparison still reveals the underlying trade-off: quiet hours are not necessarily cheap hours.
So when is the best time to trade NQ?
There are at least three defensible answers.
Best for liquidity and opportunity: 9:30–11:00 a.m.
This is where volume and range are greatest. Execution friction is low relative to the available hourly movement. It is well suited to traders who have tested rules, can act quickly, and are comfortable with rapid changes in price.
It is not automatically the best window for a beginner. The same data shows that five-second midpoint movement is largest here.
Best balance of liquidity and calmer movement: 11:00 a.m.–1:00 p.m.
Volume remains substantial, the average spread is near its daily low, and short-term movement falls from its opening-session peak. This can offer a more manageable environment, although lower movement can also produce slower or less decisive setups.
Best late-day execution conditions: 3:00–4:00 p.m.
The 3:00 p.m. hour combined the lowest average spread in the study with renewed volume and a median 92.1-point range. The trade-off is closing-session behavior: order flow can accelerate as positions are adjusted before the cash close.
“Best” still depends on the strategy. A breakout system, a mean-reversion system, and a slow pullback strategy do not want identical market conditions.
The worst times for beginners to trade
Beginners should consider avoiding the following windows until they have a tested process for them.
9:00–10:00 a.m., especially around the 9:30 cash open
This hour offers excellent liquidity, but it also contains the study’s largest median range and highest short-term movement. It punishes late entries, oversized positions, and stops chosen without reference to current volatility.
Scheduled 8:30 a.m. economic releases can create similar conditions in the prior hour. The hourly study does not isolate individual announcement minutes, so traders should use an economic calendar rather than assuming every morning behaves the same way.
The 6:00 p.m. futures reopen
The hour beginning at 6:00 p.m. had the widest average trade-time spread in the sample. Liquidity is rebuilding after the daily maintenance break, and the quoted NQ round-trip estimate was more than twice the 3:00 p.m. estimate.
The very quiet overnight hours
Midnight through 2:00 a.m. and 10:00 p.m. through midnight combined low volume with relatively high cost-to-range ratios. A slower chart can feel safer, but it may provide fewer good exits and make a short-term target less forgiving of friction.
Major scheduled announcements
An hourly average can hide a violent two-minute repricing. CPI, employment data, and Federal Reserve announcements should be treated as separate event regimes. The safest beginner rule is simple: if the strategy was not explicitly tested on announcement trades, do not improvise one in real time.
A practical time-of-day checklist
Before placing an NQ trade, ask:
- Is this a liquid cash-session hour or a thin overnight hour?
- Is a scheduled economic announcement approaching?
- Is the current spread normal for this time of day?
- Has short-term range expanded enough to require a smaller position or wider stop?
- Is the planned target large enough to absorb the spread, commissions, and probable execution error?
- Was the strategy actually tested during this session window?
Time of day should not replace a trading setup. It should determine whether the market is currently suitable for that setup.
Methodology and limitations
The analysis used Sierra Chart AMP data files for seven quarterly NQ contracts: NQH25 through NQU26. Each session was assigned to one active contract using the standard Thursday-before-expiry roll convention. The sample contains 414 sessions and approximately 200 million trade records from December 12, 2024 through July 21, 2026.
Each CME session runs from 6:00 p.m. on the prior calendar day through 5:00 p.m. ET. The 5:00–6:00 p.m. maintenance break is excluded. Eastern timestamps account for daylight-saving changes.
Hourly range is the difference between the highest and lowest trade price in that clock hour. Volume is the total recorded contract volume. Spread is the bid-ask difference attached to trade records and is therefore trade-time weighted, not time weighted. Hours with no trades do not contribute quote observations.
The slippage-risk proxy is the absolute change in midpoint after 1, 5, or 15 seconds. It measures short-term price-change risk, not actual fill slippage. The analysis cannot measure queue position or size-dependent market impact because it does not include market-depth data.
Results describe the sample, not an immutable law of NQ. Volatility regimes change. The evergreen lesson is the relationship: compare liquidity, spread, speed, and cost relative to opportunity before deciding that an hour is “good” or “bad.”
Futures trading involves substantial risk and is not suitable for every trader. This analysis is educational and is not individualized investment advice.