July 28, 2026
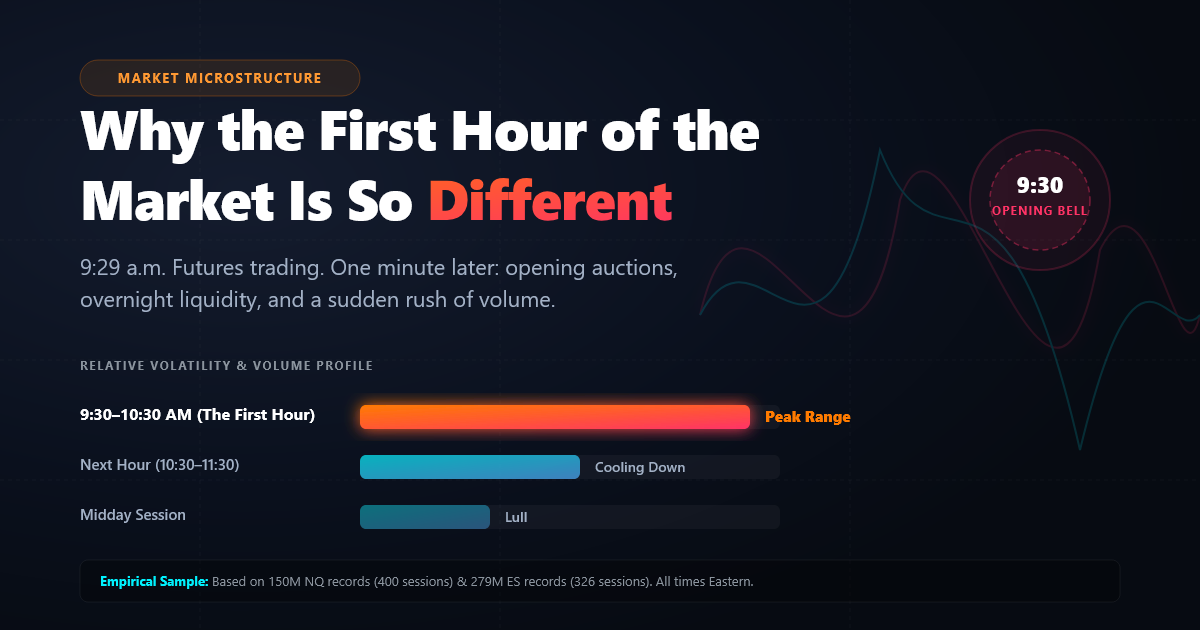
Why the First Hour of the Market Is So Different
At 9:29 a.m., Nasdaq futures are already trading. One minute later, the market is not simply busier. It is operating under a different set of conditions.
The stocks behind the index begin regular trading. Opening auctions convert accumulated orders into official opening prices. Overnight positions meet cash-market liquidity, and traders who were willing to wait suddenly have a common reason to act. Recently we tested what are the best trading hours on NQ.
The result is the first hour of the U.S. cash session: more volume, more range, and faster short-term price changes than most of the day that follows.
I measured the difference using 150,758,545 NQ trade records across 400 complete sessions and 279,030,061 ES records across 326 complete sessions. The NQ sample runs from December 12, 2024 through July 27, 2026. ES provides a separate validation sample through July 10, 2026. All times are Eastern.
The first hour in this study is exactly 9:30–10:30 a.m. It is compared with three equal windows: the next hour, midday, and the final hour before the cash close.
The short answer
The first hour is different because several forms of demand for immediacy arrive at once.
- Cash equities establish opening prices after the overnight interval.
- Orders accumulated for the open interact with the continuous market.
- Investors respond to information released since the previous close.
- Futures prices and the newly opened cash market have to remain aligned.
- Traders with different time horizons all adjust positions in the same window.
Market-microstructure research has studied this concentration for decades. Admati and Pfleiderer showed how liquidity-motivated and informed traders can strategically concentrate their activity, producing clustered volume and price variability. Madhavan and Panchapagesan described the opening auction as an information-aggregation process after the overnight interval.
The local futures data cannot identify which trader acted for which reason. It does show the resulting market state:
| Instrument | Median first-hour range | Share of full-session range | Share of full-session volume | 75th-pct. 5-sec move |
|---|---|---|---|---|
| NQ | 191.5 points | 62.6% | 28.0% | 21.5 ticks |
| ES | 31.75 points | 55.1% | 25.0% | 4.0 ticks |
The range share is not additive. A price revisited later in the day does not create new high-low range. It does show how much of the day’s eventual price territory had already been explored by 10:30.
What changes at 9:30
The futures market does not close overnight, but the underlying cash market still has a distinct opening event.
On Nasdaq, opening orders and the continuous book are brought together in the Opening Cross at 9:30. Nasdaq begins publishing opening-imbalance information at 9:25, and accepts order types specifically intended for the opening price. The exchange’s own Opening Cross documentation describes the process and timing.
This matters to NQ because the Nasdaq-100 is calculated from individual stocks. Futures can express a view overnight, but at 9:30 the component stocks begin establishing regular-session prices and absorbing cash-market orders. ES faces the same transition through the stocks in the S&P 500.
The study does not observe the equity auctions themselves, so the next step is an inference: the simultaneous arrival of cash-market prices and orders creates an unusually large reconciliation problem for index futures. The fact that the same pattern appeared in NQ and ES makes a purely Nasdaq-specific explanation less likely.
The first hour does not stay equally intense
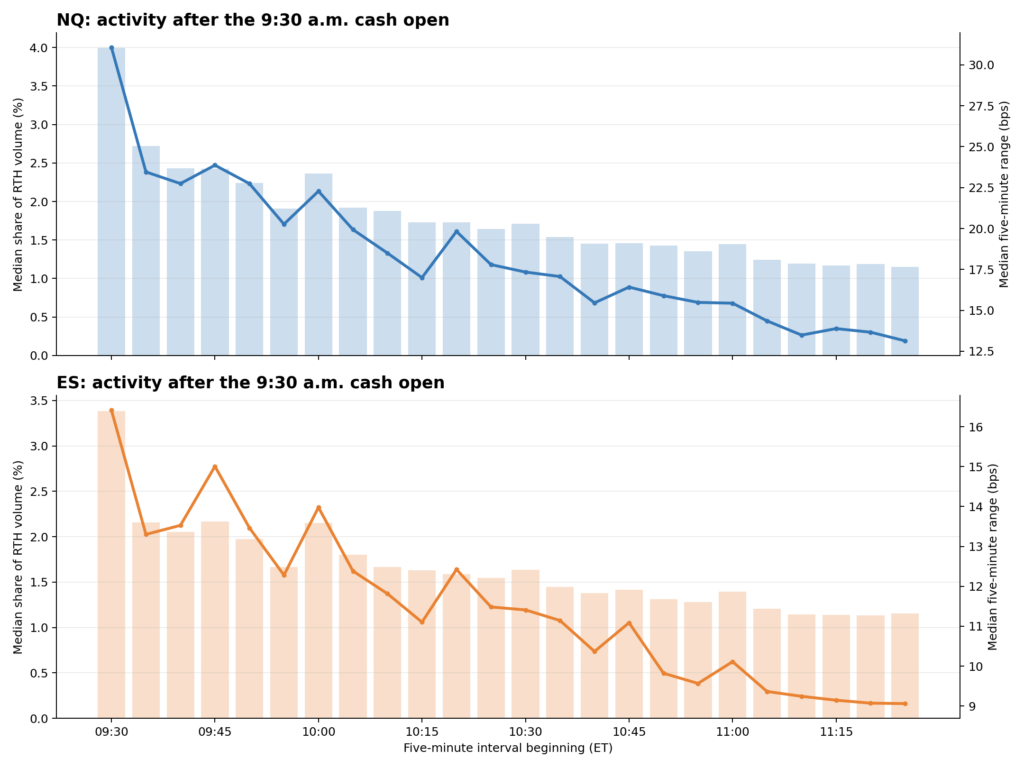
The largest discontinuity occurred immediately.
From 9:30 to 9:35, the median NQ range was 31.1 basis points, and that five-minute interval alone accounted for 4.0% of the entire regular session’s volume. By 10:25, the median five-minute range had fallen to 17.8 basis points and the volume share to 1.6%.
ES showed the same decay. Its median five-minute range declined from 16.4 basis points at 9:30 to 11.5 basis points at 10:25. Volume share fell from 3.4% to 1.5%.
The path was not perfectly smooth. Both contracts had secondary bursts, which can reflect scheduled data, a new directional move, or ordinary session variation. But the overall decline is clear: “the first hour” is not one uniform regime. The first five minutes were materially faster than the last five.
This is one reason a setup tested on 10:15 bars should not automatically be assumed to behave the same way at 9:30.
How the first hour compares with the rest of the day
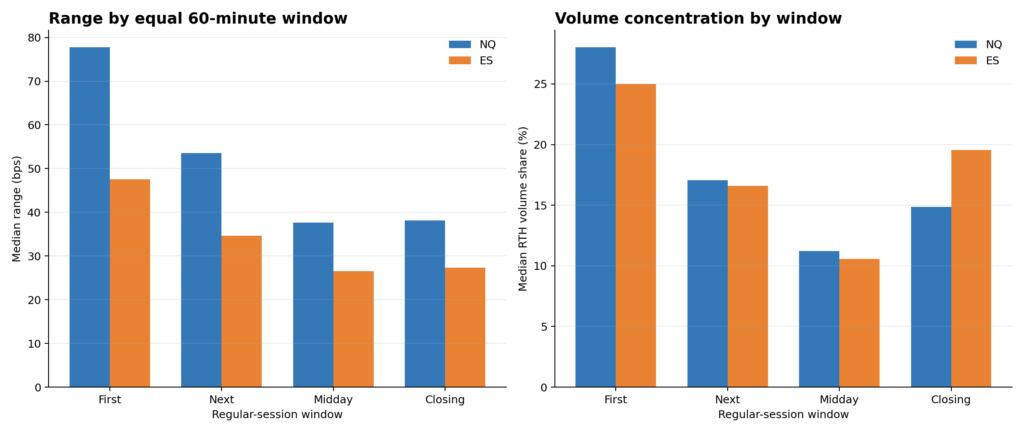
Equal-window comparisons make the concentration easier to see.
| Window ET | NQ median range | NQ volume share | ES median range | ES volume share |
|---|---|---|---|---|
| 9:30–10:30 | 191.5 points | 28.0% | 31.75 points | 25.0% |
| 10:30–11:30 | 126.75 points | 17.1% | 24.13 points | 16.6% |
| 12:00–1:00 | 93.25 points | 11.2% | 18.00 points | 10.6% |
| 3:00–4:00 | 92.75 points | 14.9% | 18.75 points | 19.5% |
The first hour represents 15.4% of a 6.5-hour cash session. Yet its median volume share was 28.0% in NQ and 25.0% in ES.
Its normalized range was also approximately twice the midday level in NQ and 1.8 times the midday level in ES. Using paired session differences, the median opening-minus-midday range advantage was 38.4 basis points in NQ, with a 95% session-bootstrap interval of 34.3 to 41.1. For ES, the difference was 18.9 basis points, with an interval of 16.6 to 23.1.
The closing hour deserves a qualification. ES volume returned strongly from 3:00 to 4:00, consistent with another concentration of deadline-driven orders. But its range remained far below the first hour. High volume and high movement often appear together, but they are not the same variable.
High liquidity does not mean slow or easy
The first hour creates a seeming contradiction. It is one of the most liquid parts of the day, yet it can also be one of the hardest times to execute a short-term decision.
The contradiction disappears when spread and price speed are separated.
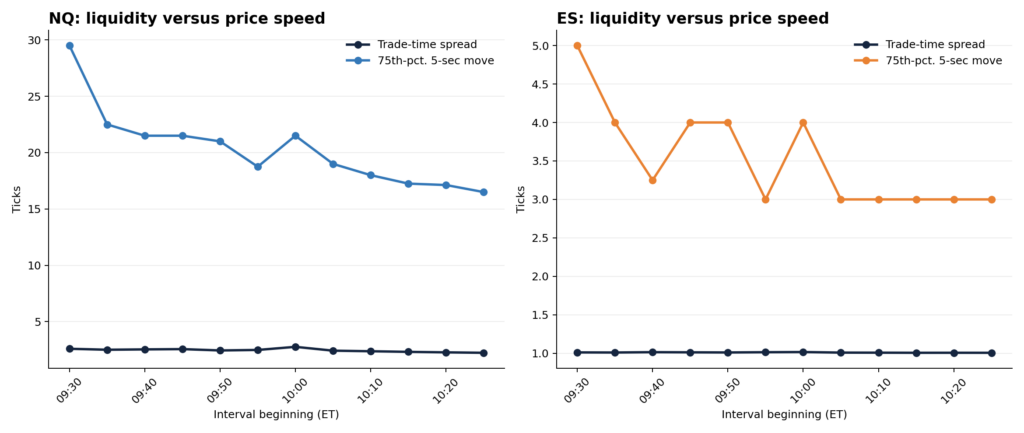
The median NQ session’s average trade-time spread was 2.52 ticks in the first hour, compared with 2.02 ticks at midday. ES remained almost continuously at its one-tick minimum: 1.014 ticks in the first hour versus 1.006 at midday.
Those differences were modest compared with the change in price speed.
The first-hour 75th-percentile five-second midpoint move was 21.5 NQ ticks, versus 11 ticks at midday. In ES, it was 4 ticks versus 2. During the opening five minutes alone, the corresponding values reached 29.5 NQ ticks and 5 ES ticks.
This measure is not observed fill slippage. It asks how far the quoted midpoint moved over a short decision horizon. A trader may receive a good fill relative to the current spread and still be late relative to a signal because the market itself moved.
The practical distinction is:
- Spread risk is the cost of demanding liquidity at the current quote.
- Latency risk is the market moving while a trader recognizes, decides, transmits, or modifies an order.
The first hour offers abundant counterparties, but it places a higher cost on hesitation.
The overnight move carries information into the open
If the open is partly an information-reconciliation process, larger moves from the prior close should be associated with a more active first hour.
That is what appeared in both contracts.
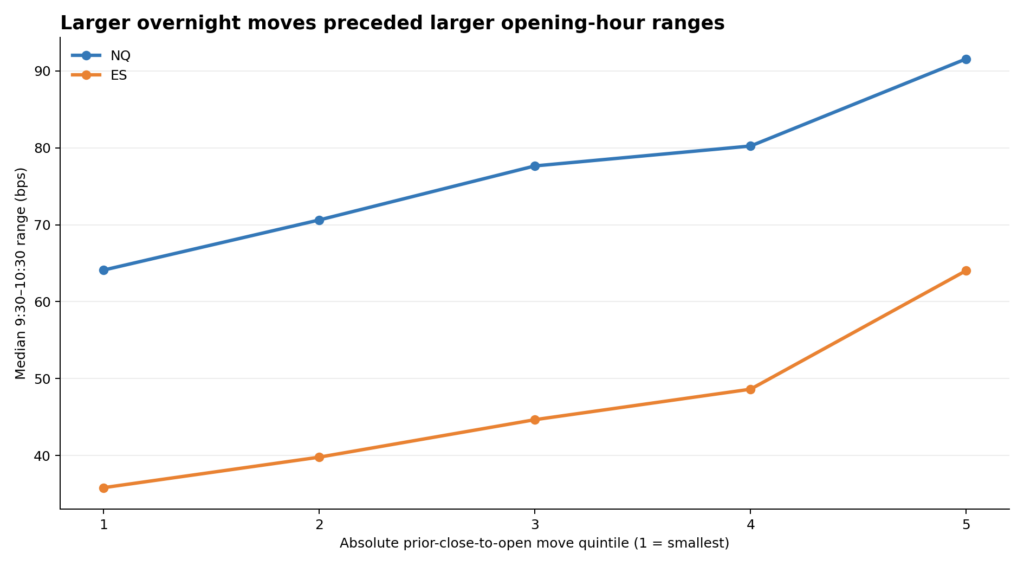
For NQ sessions in the smallest prior-close-to-open move quintile, the median first-hour range was 64.1 basis points. In the largest quintile, it was 91.6 basis points.
ES increased from 35.8 to 64.0 basis points across the same ranking.
This “overnight move” is the absolute change from the previous regular-session close to the current 9:30 futures price. It is not a claim that futures stopped trading overnight. It measures how far the market had traveled before cash equities opened.
The result also should not be read as a forecast of direction. A large overnight rally can continue, reverse, or churn after 9:30. The relationship was with the size of the first-hour range, not its sign.
What this means for a trader
The opening hour is not automatically the best or worst time to trade. It is a specialized environment.
Treat 9:30 and 10:20 as different regimes
The five-minute results show a meaningful decay within the hour. If a strategy uses fixed stops, targets, or size from 9:30 through 10:30, those parameters may be absorbing a large change in the underlying range.
Separate liquidity from speed
A narrow or workable spread does not imply that a trader has time to deliberate. Order type solves only part of the execution problem. A limit order controls price but may not fill. A market order prioritizes completion but remains exposed to rapid repricing.
Scale risk to current movement
The first hour covered a median 62.6% of NQ’s full-session range. A stop that looks reasonable at noon may be ordinary noise just after the bell. Keeping the same dollar risk may require a smaller position rather than an arbitrarily tighter stop.
Use the overnight move as context, not direction
Larger prior-close-to-open moves preceded larger first-hour ranges in both markets. That makes the overnight move useful as a volatility input. It does not say whether the next trade should be long or short.
Test the exact window
An opening-range breakout, pullback, and mean-reversion system ask different questions of the same environment. Broad statements such as “trade the first hour” are not enough. The setup should be tested on the precise minutes in which it will be used.
Methodology and limitations
The analysis used Sierra Chart Denali data for active quarterly NQ and ES contracts. Contracts were rolled on the Thursday before quarterly expiration. Only sessions with records spanning the complete 9:30 a.m.–4:00 p.m. Eastern regular session were included. Early closes and incomplete files were excluded.
NQ contains 400 complete sessions through July 27, 2026. ES contains 326 complete sessions through July 10, 2026. The June 2025 ES contract file was empty, so that quarter is absent from the validation sample rather than filled or inferred.
Range is the highest trade minus the lowest trade within a window. Volume is recorded contract volume. The quoted bid and ask attached to each trade record produce a trade-time-weighted spread, not a time-weighted NBBO. Midpoint movement measures absolute quoted-price change after 1, 5, or 15 seconds; it does not include queue position, order size, commissions, or actual fills.
Statistics were calculated at the session level. Confidence intervals resample complete sessions with a fixed seed. The overnight analysis excludes contract rolls and long gaps between observations.
The study establishes a repeatable association among the cash open, volume, range, and price speed. It cannot assign causality to opening auctions, institutional orders, news, hedging, or any individual class of trader. Scheduled releases can also create event regimes that a five-minute median will not isolate.
The durable conclusion is narrower: the first hour concentrates opportunity and execution risk at the same time. More liquidity makes trading possible. Faster price discovery is what makes it different.
Futures trading involves substantial risk and is not suitable for every trader. This analysis is educational and is not individualized investment advice.