October 17, 2025
The Volatility Smile and Skew: What They Tell You About Market Expectations
Introduction
In options markets, implied volatility (IV) is rarely constant across all strikes and expirations. Instead, traders observe patterns known as the volatility smile and volatility skew (or smirk) – graphical curves that show how IV varies for options with the same expiration but different strike prices. These patterns deviate from the flat IV line predicted by a basic Black-Scholes model (which assumes constant volatility) and instead reflect the market’s nuanced expectations of future volatility and risk. Understanding volatility smiles and skews is crucial for options traders, as their shape and slope provide insight into market sentiment, perceived tail-risk (probability of extreme moves), and can inform effective trading strategies.
What is a Volatility Smile?
A volatility smile describes a U-shaped or “smile-like” curve that appears when you plot implied volatilities against strike prices for a given expiration. In a volatility smile, IV is highest for deep in-the-money (ITM) and deep out-of-the-money (OTM) options, and lowest for at-the-money (ATM) strikes. In other words, both far-OTM puts and far-OTM calls carry higher implied vols than ATM options, causing the plot to bend upward at both ends (hence the name “smile”). This pattern suggests the market assigns extra risk to extreme price moves in either direction. A pronounced smile often indicates that traders expect large price swings (high uncertainty) in the underlying asset, up or down. It effectively shows that option prices on the “wings” (far ITM/OTM) are elevated, consistent with the market pricing in fat-tail distributions – a higher probability of extreme outcomes than a normal distribution would predict.
The volatility smile phenomenon became widely recognized after the 1987 stock market crash. Prior to 1987, U.S. equity options implied volatilities were relatively flat across strikes. But post-1987, traders began reassessing the probability of extreme events (“fat tails”), resulting in much higher prices (and IVs) for far OTM options, especially puts. In other words, the crash taught the market that extreme downside moves were more likely than previously thought, and options markets permanently adjusted by assigning greater implied vol to tail strikes. This is why a volatility smile (or skew) is now commonly observed, invalidating the Black-Scholes assumption of log-normal returns with constant volatility. The smile’s existence highlights that real-world return distributions have heavy tails and skew, so traders demand more premium (higher IV) for options that pay off in extreme scenarios.
Example of a volatility smile – implied volatility tends to be lowest for ATM options and higher for deep ITM or OTM options (forming a U-shaped curve). Such a smile indicates the market is pricing in greater risk for extreme moves in either direction.
Market expectations: A volatility smile implies bidirectional concern – traders foresee the possibility of big moves up or down. For example, before a major earnings announcement or other binary event, both call and put IVs may rise, producing a smile. In such cases, the market is essentially “on guard” for volatility in either direction. An illustrative example is a stock ahead of earnings: if investors think an upcoming report could either send the stock soaring or crashing, demand for both OTM calls and OTM puts increases, lifting their IVs. Empirically, traders have observed volatility smiles around events like earnings surprises or “black swan” fears – e.g. during periods of high uncertainty, OTM calls and puts both trade at a volatility premium as insurance against large swings. A steep smile (very high wing IVs) suggests the market assigns significant probability to tail events, equating to “jump risk” – the chance of sudden, large price moves. Essentially, the smile’s curvature visualizes market fear of volatility: the deeper the smile, the more the market is bracing for turbulent moves (in either direction).
What is Volatility Skew (the “Smirk”)?
While “volatility smile” is a general term, many markets – especially U.S. equities – exhibit an asymmetric smile, known as a *volatility skew or smirk. A volatility skew refers to IV that varies by strike in a lopsided way, typically sloping downward as strikes increase. In practice, this often means OTM put options have substantially higher implied volatilities than OTM call options on the same underlying. The result is a skewed smile (resembling a sly “smirk”), where IV is highest for lower strikes (deep OTM puts) and declines for higher strikes (OTM calls). This pattern is extremely common in equity index and stock options – it’s sometimes called the “reverse skew” or “put skew” because puts are more expensive (in IV terms) than calls at comparable moneyness. By contrast, a “forward” or positive skew (higher IV for calls than puts) is less common in equities, but can appear in certain markets like commodities where sudden price spikes to the upside are a primary concern.
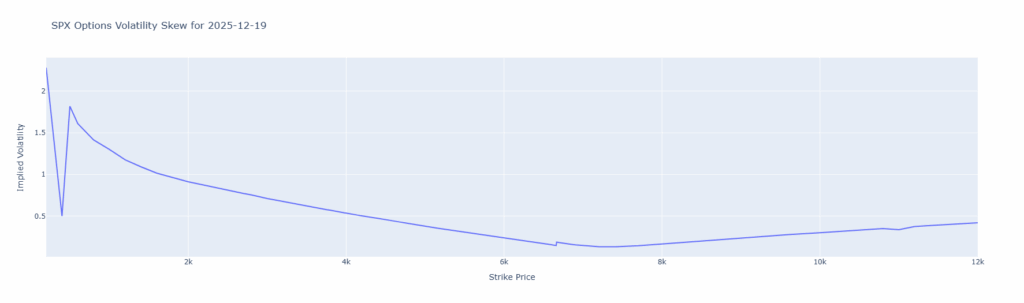
Why does skew exist? In equity markets, the skew largely reflects investors’ greater fear of downside crashes versus explosive upside. Market participants are often more willing to pay for protective puts than for speculative calls. This is partly because many investors hold long stock and seek insurance against losses – creating heavy demand for OTM puts as protection, which bids up their price/IV. Meanwhile, there is typically less persistent demand for far OTM calls (aside from occasional speculative frenzies), so their IV stays lower in comparison. Investopedia explains that investors perceive downside risk as more acute than upside potential, since a stock can plummet to zero (100% loss) but has no defined upper limit. The result: OTM puts carry a volatility premium, and the IV curve slopes downwards from puts to calls. This negative skew suggests the market is more anxious about downward moves – it is effectively pricing in a higher likelihood of a sharp drop than a comparably large rally. In other words, a steep volatility skew is a sign of bearish market sentiment or crash fear, with traders “bidding up” put options for downside protection. (By contrast, a positive skew – rarer for equities – would indicate traders bracing more for upside risk, as is sometimes seen in commodity markets prone to supply shocks.)
It’s important to note that volatility skew is not static; it can fluctuate with market conditions and events. Major downturns or crises tend to steepen the put-skew (investors rush to buy puts, driving OTM put IV even higher). For instance, the 1987 crash famously led to a permanent skew in index options as investors thereafter paid a premium for crash protection. Even on shorter timescales, if sudden fear hits (e.g. a weak economic report or geopolitical shock), traders may aggressively buy puts, causing the skew to become more negative (steeper). Conversely, during calmer periods or after fear subsides, the skew may relax somewhat (flatten). Monitoring skew over time thus offers clues about changing market expectations – a sharply widening skew can signal rising concern of a downside event, while an abnormally flat skew might suggest complacency.
Term Structure of IV (Across Expirations)
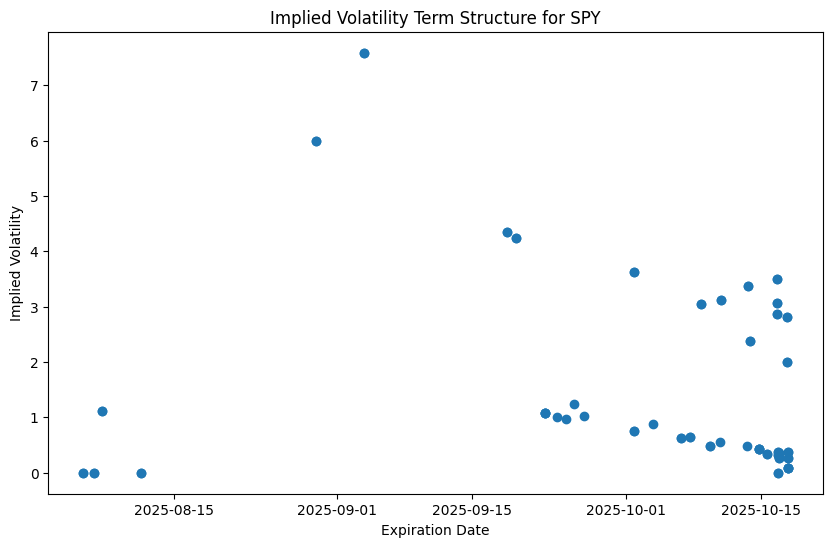
Beyond strike-based smiles and skews, options traders also examine the term structure of implied volatility – how IV varies across different expiration dates. Typically, one plots the IV of similar-strike (often ATM) options against their expiries to visualize this term structure. The “volatility term structure” is essentially the time dimension of the volatility surface, and it reveals how the market’s volatility expectations change over the near-term vs long-term. In normal conditions, the IV term structure for equities is often upward sloping (contango) – longer-dated options have higher implied vol than near-dated options. There are a few reasons for this: (1) Greater uncertainty in the long run – the farther out in time, the more chance for dramatic price changes, so more volatility is priced in. (2) Event risk – longer horizons are more likely to encompass major events (economic cycles, geopolitical shifts, etc.), and thus carry a volatility premium. (3) Time value premium – longer-dated options inherently have more time value, which tends to boost their implied vol relative to short expiries. In practice, an upward-sloping term structure suggests the market expects gradually increasing volatility (or at least prices in more uncertainty over time).
However, the term structure shape can vary. Sometimes it’s downward sloping or inverted – for example, ahead of a scheduled event like an earnings release or a Fed meeting, the very near-term options might have spiked IV (pricing in the event’s volatility) that exceeds longer-term IV. In such cases, the curve might hump or slope down in the short term. A flat term structure would imply the market expects similar volatility across all horizons. Traders pay close attention to these shapes: a near-term IV spike could indicate an imminent volatility event, while a steep long-term climb may indicate uncertainty or risk perceived farther out. Notably, term structure and skew often interact – for instance, short-dated options might exhibit a different skew profile (often more pronounced) than longer-dated options. Near-term skews can be extreme if a binary event is looming (e.g. this week’s options may show a big volatility smile around an earnings date, whereas next month’s are flatter once the event risk is gone). On the other hand, longer-term options, averaging out many potential moves, might show a gentler skew. In any case, combining the strike dimension (smile/skew) with the time dimension (term structure) gives the full implied volatility surface, which advanced traders use to gauge market expectations in 3D.
What Smiles and Skews Tell Traders
Volatility smiles and skews are rich in information about market sentiment and expected risk. A few key interpretations for options traders:
- Tail-risk and Jump Fears: A steep volatility smile signals that tail risks loom large in traders’ minds. The market is pricing in a significant probability of a “jump” in the underlying – an abrupt, large move. For example, during the COVID crash or other crises, implied volatilities for far OTM options shot up, reflecting worries of another sudden collapse. For a trader, recognizing this can inform risk management: e.g. if you see an extreme smile, you know the market is on edge about unpredictable moves.
- Directional Sentiment (Skew): The skew tells you which side of the market – downside vs upside – traders are more concerned about. A pronounced negative skew (common in stocks) means downside protection is in high demand – the market’s expectation (or fear) is skewed toward a drop. Traders reading this might deduce bearish or risk-off sentiment: investors are hedging against declines. On the other hand, a positive skew (rare for equities) would indicate more concern about upside moves (perhaps in a commodity facing a potential shortage, where calls get bid up). In summary, skew is often called the “smile of fear” – for equities it usually points downward, encapsulating investors’ crashophobia (crash fear). A sudden change in skew can also be informative: if the skew is becoming more negative over time (puts relatively more expensive), it suggests growing pessimism or demand for hedges.
- Relative Value and Mispricing: Smiles and skews can highlight potential mispricings or arbitrage opportunities. In theory, if markets were perfect, all strikes would have the same IV for a given expiry (no smile) – differences mean some options are relatively expensive or cheap. Traders might ask: Are OTM puts too expensive relative to ATM? If one believes the market overestimates crash risk, selling richly-priced OTM puts could be profitable (though risky). Conversely, if OTM calls are underpriced but there’s a catalyst for a big rally, buying those calls might have an edge. Arbitrage is difficult in practice (since skew is usually justified by risk and hard to exploit after transaction costs). Nonetheless, volatility sellers often thrive by harvesting risk premium from options that trade at high IV due to fear. For instance, systematically selling OTM puts (to earn the “insurance premium” others pay) is a strategy some use – albeit one that can blow up if the feared event materializes. The key is that smile/skew patterns let traders identify which strikes might be rich or cheap relative to theoretical models or historical norms.
- Risk Management and Hedging: Understanding skew is vital for hedging. If you hold a stock portfolio, a steep skew means buying put protection will be costly – the market demands a big premium for that insurance. Traders might respond by using spreads or alternative hedges. For example, rather than buying expensive deep OTM puts outright, one might implement a put spread (buy one put, sell a farther OTM put) to offset the high cost of tail protection. Skew also means that stop-loss strategies or dynamic hedging may be preferable in some cases to paying for overpriced options. On the flip side, if you need to hedge a downside risk, recognizing that OTM puts are expensive warns you that protection comes at a steep cost – which itself reflects the market’s view of risk.
- Market Regime Shifts: By watching the term structure along with skew, traders can infer how the market’s volatility expectations evolve. For instance, if near-term IV is low but longer-term IV is high, the market might be complacent now but worried about turbulence later (perhaps due to an approaching election or recession fears). If the skew is steep now but you expect calm to return, you might anticipate the skew to flatten (which could benefit certain option positions). In contrast, if an earnings report is coming next week, the one-week options will show a jump in IV (event volatility) while longer expiries might be lower – after the event passes, that term-structure hump will collapse. Traders adept in these analyses might, for example, sell options expiring just after a major event (where IV is inflated), and buy longer-term options (where IV is relatively lower), betting that volatility will normalize post-event.
Practical Implications and Strategies for Traders
For retail traders and professionals alike, volatility smiles and skews are more than academic curiosities – they directly impact options strategy selection and pricing. Here are some practical takeaways and strategies:
- Choosing Strikes: When structuring an options trade, be mindful of the skewed IV. OTM puts carry higher IV (and premiums), while OTM calls often carry lower IV. If you are bullish on a stock, selling a put might offer a juicier premium (thanks to skew) than selling a call at an equivalent distance OTM. Of course, selling the put means taking on downside risk – but the skew “pays” you to assume that risk via a higher premium. Conversely, if you want to bet on upside with calls, note that OTM calls are relatively cheap IV-wise in equity markets. This can be good (lower IV means cheaper options to buy), but also reflects that the market sees less likelihood of a huge rally. Always consider whether the skew is justified by fundamentals; sometimes skew may be overstating or understating true risk, which can be an opportunity if you have a differing view.
- Spread Strategies: Volatility skew opens the door to spread trades that exploit IV differentials. A classic example is the bear put spread. Suppose a trader is moderately bearish on a stock. Instead of buying a put alone (and paying the high IV for a low strike put), they could buy a put at-the-money (lower IV) and simultaneously sell a farther OTM put (higher IV). This bear put spread benefits from the skew: the put you sell has inflated implied volatility (hence a richer premium) relative to the one you buy. The spread thus reduces cost while still providing downside protection/profit if the stock falls – effectively financing part of the ATM put purchase by selling overpriced tail volatility. Similarly, a bull call spread could exploit positive skew scenarios (buy lower-IV call, sell higher-IV call if the skew were upward sloping). Another skew-based tactic is the ratio spread – for instance, buy 1 ATM put and sell 2 farther OTM puts. This takes advantage of expensive OTM put IV, but carries tail risk (short an extra put) so it must be used cautiously. The common thread is sell the higher-IV strike and buy the lower-IV strike to capitalize on the skew differential.
- Long Vol Strategies (Straddles/Strangles): A volatility smile suggests the market expects big moves, but there may be instances where you believe even the elevated wing vols aren’t high enough. If you foresee turbulence that the market isn’t fully pricing, a long straddle or strangle can be attractive. A long straddle involves buying an ATM call and an ATM put, aiming to profit if the stock makes a large move in either direction. You’d employ this if you suspect a looming catalyst will cause more volatility than implied by current options (even if there’s already a smile, you think it should be steeper). The presence of a smile means others do anticipate movement, but your edge might be in timing or magnitude. Similarly, one might buy a strangle (OTM call + OTM put) if expecting an outsized move; note, however, that if a smile is present, those OTM options will be pricey. Timing entry is key – often implied volatilities run up before known events and then crush afterward. A savvy trader might buy options before the IV surge, then possibly take profit before the event to avoid the post-event IV crush. The volatility smile helps traders identify when the market is pricing in a move and when it isn’t: e.g. “IV is flat – perhaps the market is asleep on this upcoming event” or “IV is very steep – the event risk is well anticipated.” You generally want to buy options when IV is too low for the situation, and consider selling when IV (especially for wings) seems overly high.
- Hedging and Tail Risk Management: If you’re looking to hedge a portfolio against tail risk, understanding the skew is crucial. High skew = expensive tail hedges. Traders often use collar strategies or put spreads to mitigate the cost. For example, to protect a stock position, one might buy an ATM or slightly OTM put (which has lower IV than a deep OTM put) and finance it by selling an OTM call. This collar takes advantage of the fact that the put’s cost is somewhat subsidized by selling a call (though the call has lower IV, you’re selling upside which you may not mind capping). Another approach: dynamic hedging – if puts are prohibitively expensive, some portfolio managers choose to hedge by shorting futures or shares during declines instead of buying a lot of costly put options. The bottom line is, skew informs your hedging tactics: when skew is extreme, outright purchases of tail options are costly and alternatives should be considered.
- Using Skew as a Signal: Some traders even use changes in volatility skew as a market signal. For instance, a sudden increase in put IV (skew turning more negative) can be a warning sign of impending market stress – essentially the options market shouting “we’re worried about a drop”. Traders might tighten risk management or reduce positions when they see the skew become unusually steep. Conversely, if skew is very flat or an established skew starts to moderate, it could indicate a more benign outlook or that hedgers are less desperate for protection. However, skew should be used in conjunction with other indicators; it’s one piece of the puzzle. Sometimes skew changes due to supply/demand quirks (e.g. market makers hedging) rather than a fundamental shift, so context matters. Nonetheless, monitoring skew is part of many traders’ playbooks for gauging market sentiment shifts.
Examples from the Market (US Equities Focus)
To solidify these concepts, let’s look at a couple of scenarios in U.S. equity options:
- Index Options (S&P 500 – SPX/SPY): Equity index options notoriously exhibit a strong negative skew. Investors routinely buy index puts for portfolio insurance, driving those implied vols higher relative to calls. A snapshot of SPY (S&P 500 ETF) options will typically show ATM IV (say 1-month ATM ~20%) and an increase as strikes go down – e.g. 10% OTM puts might have significantly higher IV (25% or more), whereas 10% OTM calls might have slightly lower IV (~18%). This skew “smirk” visually slopes downward from left (puts) to right (calls). What does it tell us? Essentially, the market expects (or fears) a sharp drop more than a sharp rally. The demand for crash protection is so persistent that put options command a hefty premium. For a trader, selling OTM index puts can earn high premium but comes with large tail risk. Buying index puts, while expensive, provides peace of mind against crashes – that cost is the “fear premium” an investor pays to sleep at night. Notably, during calmer bullish periods, the skew might flatten a bit (OTM put IV comes down as complacency grows), whereas during times of stress or uncertainty (e.g. 2020 pandemic onset), the skew gets extremely steep (investors panic-buying puts). Seasoned traders watch these changes: an extreme skew can indicate panic hedging, which sometimes precedes market bottoms (everyone already paid for insurance, so who’s left to buy puts?). Conversely, a very low skew might indicate overconfidence – a vulnerability if a shock hits unexpectedly.
- Single Stock Example (Earnings Event): Consider a company like Foot Locker (FL) ahead of an earnings report. Suppose the stock recently plunged 30% on a bad sales quarter; now another earnings release is approaching and uncertainty is high. Options expiring just after the announcement will likely show a volatility smile: both calls and puts have elevated IV, reflecting the possibility of a big move up or down depending on the news. Traders expecting a rebound might be snapping up calls, while others fearing more bad news load up on puts – demand comes from both sides, lifting the wings. The ATM straddle IV might also be very high, pricing in, say, a 15% one-day move. If the report is a non-event, anyone who bought this pricey premium will lose out as IV collapses. But if a big move does occur (up or down), the options pay off. This scenario shows a more symmetrical smile due to a binary event: the market isn’t sure of direction, just that volatility will be large. A trader aware of this smile might deploy a strategy like an iron condor (sell both an OTM call and put spread) if they believe the market is overstating the likely move – essentially betting the implied move won’t materialize. Alternatively, if you think the market is underestimating the potential jump (maybe you expect an even bigger surprise), you’d buy options despite the high IV, because you foresee an outcome beyond what’s priced in. Once the earnings pass, that event-driven smile usually disappears – wing IVs fall back in line, reminding us that smiles can be temporary when tied to one-off events.
- Meme Stock or Takeover Speculation: In rare cases, individual stocks can show a positive skew. This was seen briefly in some “meme stocks” during 2021, where call options became extremely popular bets on further upside. For instance, at the height of a frenzy, far OTM calls on stocks like GameStop or AMC traded at exorbitant IVs (higher than corresponding puts) due to one-way speculative demand for calls. A more traditional example is a stock rumored to be a takeover target: traders might bid up OTM calls (anticipating a buyout at a premium) more than OTM puts. In such situations, the skew can tilt upward – OTM calls overpriced relative to puts – signaling the market is more focused on an upside jump than a downside crash. For a trader noticing this, strategies like call spreads or risk-reversals become interesting. A risk-reversal involves selling the overpriced side and buying the underpriced side – e.g. in a positive skew scenario, one might sell OTM calls and buy OTM puts to bet that the skew will normalize (or to hedge a long position cheaply). In a negative skew scenario (typical equity), a bullish trader might do the opposite: sell an OTM put (rich premium) and buy an OTM call (cheap upside insurance), effectively getting paid to take a bullish stance. These trades reflect how skew informs which options to buy vs sell for efficient positioning.
Conclusion
Volatility smiles and skews are fundamental concepts in options trading that go beyond the basic pricing models. They encode the market’s collective expectations and fears. A volatility smile tells us that traders see outsized moves as plausible – it’s a graphical insight into perceived tail-risk and event risk in the market. A volatility skew, especially the persistent one in equities, lays bare the asymmetry in sentiment – typically, a greater concern for market drops than for rallies. For options traders, understanding these patterns is not just about theory; it’s about recognizing how supply and demand for options at various strikes reflect real-world fears and greed.
Practically, smiles and skews guide traders in selecting strategies: whether it’s structuring spreads to exploit high-IV strikes, timing volatility trades around events, or hedging in cost-effective ways. They remind us that implied volatility is itself a price – a price of risk – set by the market. When you see a smile or skew, you are seeing the market’s odds and insurance premiums laid out. High IV at a strike means “traders demand a lot to insure that scenario,” and that can be either a caution (maybe that risk is very real) or an opportunity (maybe fear is overblown). By studying how IV varies across strikes and expiries, even a retail trader can gain an edge in understanding the market’s expectation of future volatility. In short, the volatility smile and skew offer a window into the market’s collective mind – revealing where it anticipates turbulence and where it doesn’t – and savvy traders use that knowledge to navigate their options positions more intelligently.
Sources: The concepts and examples above are supported by options market research and educational resources, including Investopedia, Wikipedia, and industry experts. These sources discuss how implied volatility patterns reflect market sentiment, why equity options show a skew (often called the volatility “smirk”), and how traders can interpret and leverage these patterns in practice.