July 24, 2026
When Positive Delta Turns Bearish in NQ
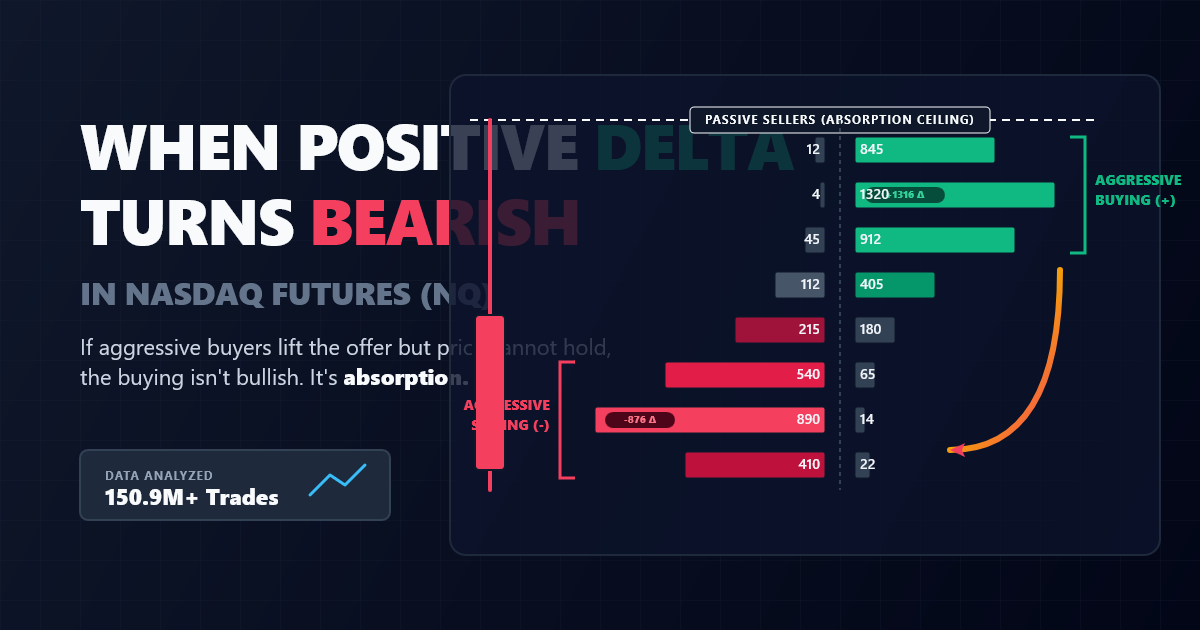
Positive delta is supposed to mean buyers are in control. Sometimes it means the opposite.
If aggressive buyers repeatedly lift the offer but NQ cannot hold near the high, the important information may not be the buying itself. It may be the market’s failure to respond to that buying.
This is often called absorption. Passive sellers appear willing to fill the market buy orders without allowing price to advance. Traders can see the interaction on a Numbers Bars or footprint chart, but the explanation usually ends with a hand-picked screenshot.
I wanted to know whether the behavior survives a larger test.
I reconstructed five-minute NQ footprints from 150,952,726 regular-session trade records across 414 sessions, covering December 12, 2024 through July 23, 2026. I then measured what happened after aggressive order flow collided with failed price progress at a recent high or low.
The result was narrow but interesting:
Strong opposing delta at a rejection bar preceded a short-term NQ reversal. The effect was clearest over the next five minutes and faded at longer horizons. Conventional three-level stacked imbalances did not improve the signal.
That last point matters. The most visually dramatic footprint feature was not the most informative one.
The setup in plain English
Consider a five-minute NQ bar that trades above every high from the previous hour. Buyers are aggressive enough to produce strongly positive delta, but the bar closes near its low.
Three things happened:
- Price tested a meaningful local extreme.
- Market buyers were aggressive.
- Their aggression failed to produce a strong close.
That is the bearish failed-aggression setup. The bullish version is identical in reverse: NQ makes a new one-hour low, aggressive selling produces strongly negative delta, and the bar closes near its high.
The study treats these as mirrored examples of the same mechanism. Returns are signed in the expected reversal direction, so a decline after failed buying and a rally after failed selling are both positive.
Exact signal definition
The primary analysis used five-minute bars during the 9:30 a.m.–4:00 p.m. Eastern session.
A bearish price rejection required:
- A high at or above the highest high of the previous 12 bars.
- A close in the lower 40% of the bar’s range.
- A complete next bar so the measurement could begin after the signal.
Failed buying required ask volume minus bid volume to equal at least 10% of the bar’s total classified volume. For example, a bar with 11,000 contracts at the ask and 9,000 at the bid has delta of +2,000 on total volume of 20,000, or +10%.
The bullish definition reversed each choice:
- A low at or below the prior 12-bar low.
- A close in the upper 40% of the range.
- Delta at or below −10% of classified volume.
To reduce repeated measurements of the same price test, I ignored new price-rejection signals for 30 minutes after an accepted event. This cooldown was applied before examining delta or footprint imbalances.
Entry was measured from the first traded price of the next five-minute bar. Nothing inside the signal bar was used as a hypothetical fill.
The five-minute result
Across the bearish and bullish versions, the study found 49 failed-aggression events with complete five-minute outcomes. They occurred in 39 different sessions.
| Condition at a price rejection | Events | Mean 5-minute reversal | Median | Favorable closes |
|---|---|---|---|---|
| All price rejections | 1,760 | −0.16 points | −0.63 points | 48.3% |
| Non-positive directional aggression | 1,041 | −0.52 points | −1.00 points | 47.6% |
| Failed aggression of at least 10% | 49 | +5.75 points | +3.50 points | 63.3% |
The 95% session-clustered bootstrap interval around the 5.75-point mean was +1.72 to +10.25 points.
More importantly, the failed-aggression sample outperformed the disjoint non-positive-aggression group by 6.27 points. The bootstrap interval for that difference was +2.03 to +10.91 points.
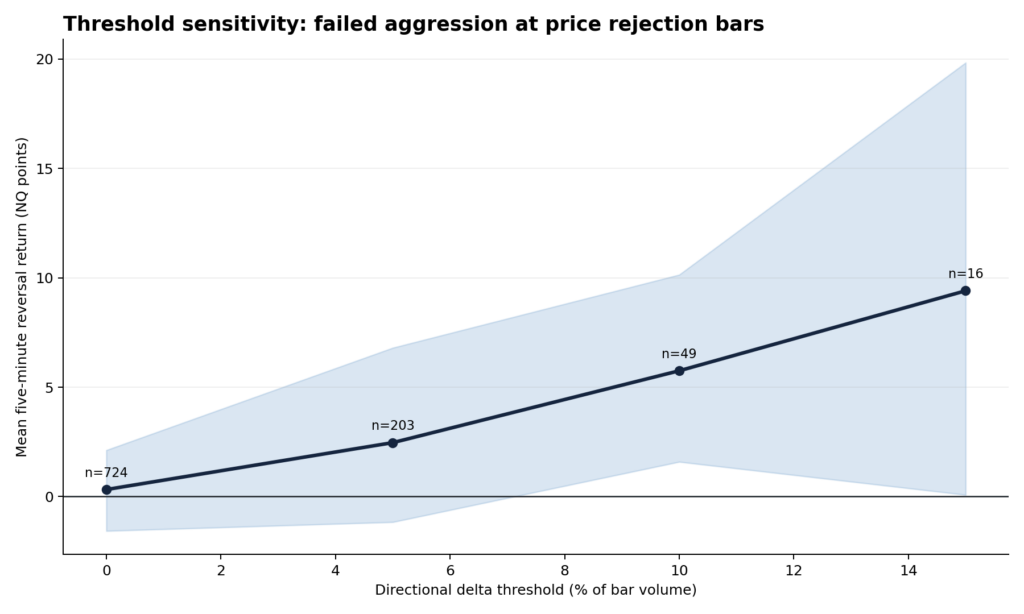
The threshold analysis moved in the direction the hypothesis would predict. Stronger aggression combined with failed price progress produced a larger immediate reversal:
| Directional delta threshold | Events | Mean 5-minute reversal | 95% bootstrap interval |
|---|---|---|---|
| 0% | 724 | +0.32 points | −1.57 to +2.12 |
| 5% | 203 | +2.46 points | −1.17 to +6.80 |
| 10% | 49 | +5.75 points | +1.59 to +10.14 |
| 15% | 16 | +9.41 points | +0.08 to +19.83 |
This is not evidence that 15% is an optimal trading parameter. Only 16 events qualified at that level, and the confidence interval became very wide. The useful observation is the broader effort-versus-result relationship, not the largest number in the table.
Failed buying and failed selling agreed
The result did not depend entirely on one direction.
The 33 failed-buying events averaged a 4.96-point decline over the next five minutes when declines were scored as positive. Twenty-two of the 33 outcomes, or 66.7%, closed in the reversal direction. The bootstrap interval around the mean was +0.45 to +9.88 points.
The 16 failed-selling events averaged a 7.38-point rally. Nine of the 16 closed favorably, and the mean’s interval was +0.78 to +15.84 points.
The bullish sample is small, so it should be treated as a directional cross-check rather than a standalone conclusion. Still, reversing every rule did not reverse the result. That is consistent with a general failed-aggression mechanism.
The two chronological halves of the sample also remained positive:
| Period | Events | Mean 5-minute reversal | Favorable closes |
|---|---|---|---|
| Dec. 2024–Nov. 2025 | 27 | +4.71 points | 63.0% |
| Dec. 2025–July 2026 | 22 | +7.02 points | 63.6% |
This split does not replace a true untouched out-of-sample test, but it reduces the chance that the combined result came entirely from one brief market regime.
The effect was short-lived
Failed aggression did not produce a clean, steadily expanding reversal.
| Horizon | Events | Mean reversal | 95% bootstrap interval |
|---|---|---|---|
| 5 minutes | 49 | +5.75 points | +1.72 to +10.25 |
| 15 minutes | 47 | +7.60 points | −0.88 to +17.43 |
| 30 minutes | 45 | +4.60 points | −4.70 to +16.29 |
At 15 and 30 minutes, the uncertainty included zero. The result therefore looks more like a brief order-flow response than evidence of a durable half-hour trend.
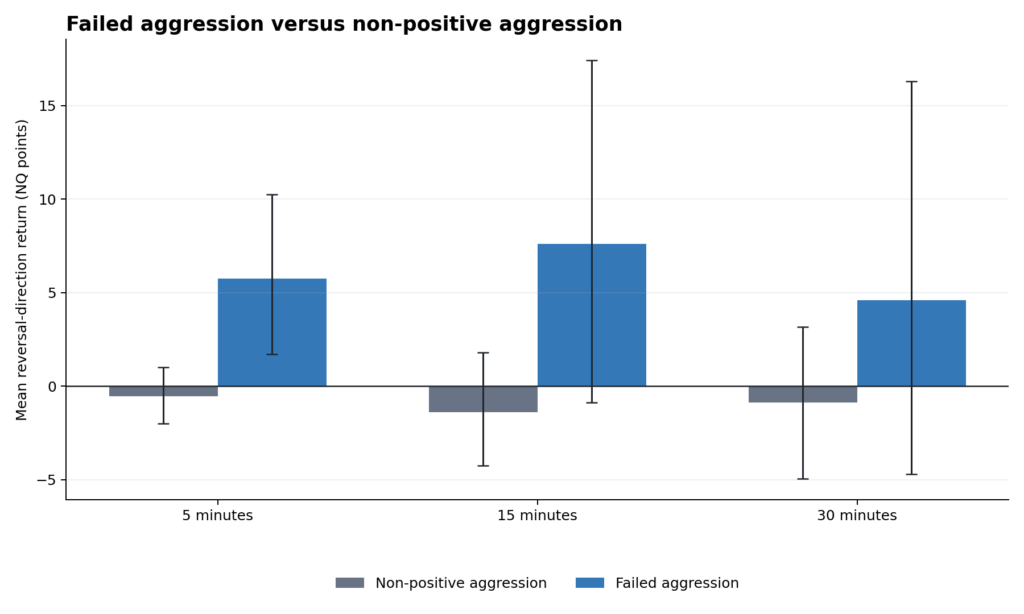
That interpretation makes market-structure sense. Once aggressive traders fail at an extreme, price may quickly move away as their flow disappears or late positions exit. Nothing in the setup guarantees that a larger directional auction will follow.
The average five-minute maximum favorable excursion was 17.03 points, while average maximum adverse excursion was 9.38 points. Those figures describe the path, not a realizable target-and-stop combination. Bar-level highs and lows do not reveal which excursion happened first.
Stacked imbalances did not add the expected edge
Numbers Bars traders often focus on stacked diagonal imbalances. I tested the standard idea directly.
A buy imbalance at price p required ask volume to be at least three times bid volume one tick below, with at least 10 contracts on the aggressive side and a nonzero comparison cell. A stack required three consecutive imbalance prices. For a bearish setup, the stack’s midpoint had to occur in the upper half of the bar. The sell-side rule was mirrored.
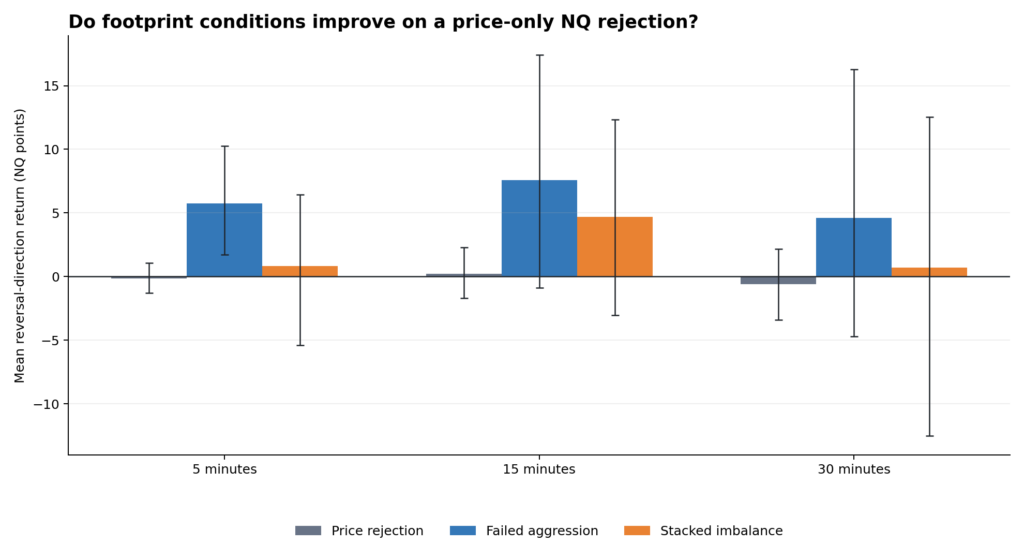
There were 129 price-rejection events with a directionally relevant stack and a complete five-minute outcome. Their mean five-minute reversal was only +0.81 points, with a wide interval from −5.40 to +6.42 points.
Requiring both a 10% failed-aggression reading and a qualifying stack reduced the combined sample to only six five-minute events. That intersection is too sparse to support a conclusion.
This does not prove stacked imbalances are useless. It shows something more specific:
Under this five-minute, 3:1, three-level definition, the stack did not improve the rolling-extreme rejection signal in this sample.
Different bar types, minimum-volume filters, or imbalance calculations may behave differently. But the result is a useful warning against treating a visually prominent footprint pattern as self-validating.
What the Numbers Bars actually contributed
A candle alone can show rejection. It cannot show whether traders were aggressively buying into that rejection or aggressively selling away from it.
That distinction was the useful contribution of the footprint data.
All price rejections averaged approximately flat behavior over the next five minutes. The subset with forceful order flow in the direction that just failed behaved differently. In other words, the test did not find that rejection bars are generally predictive. It found that the relationship between executed aggression and the resulting close carried information.
This is the classic auction-market idea of effort versus result:
- High aggressive effort plus strong progress can indicate acceptance.
- High aggressive effort plus weak progress can indicate absorption or exhaustion.
- Delta without price context is incomplete.
The finding also explains why “positive delta is bullish” is an unreliable rule. Delta describes where market orders executed. It does not tell us whether those orders moved price efficiently.
What this study cannot prove
The Sierra Chart records classify executed volume at the bid and ask. They do not identify individual traders, motives, resting order sizes, or queue position.
Calling every failed-aggression event “trapped buyers” would go beyond the data. Some buyers may have been opening positions, some closing shorts, and some executing multi-leg strategies. Absorption is an inference from the combination of aggressive executions and poor price progress.
The event study is also not a strategy backtest:
- It does not subtract commissions or slippage.
- It does not prescribe an entry order, stop, or target.
- It does not resolve the sequence of intrabar highs and lows.
- It allows outcomes from separate accepted signals to overlap after the 30-minute signal cooldown.
- It tests one primary bar size and one market session.
- The sample contains only 49 primary failed-aggression events.
The bootstrap resampled whole sessions so that events from the same trading day were not treated as fully independent. Confidence intervals still cannot protect against every form of regime change or specification risk.
Practical takeaway
The useful question on a Numbers Bars chart is not:
Is delta positive or negative?
It is:
What did price accomplish with that aggression?
In this sample, strong buying at a recent high became bearish when NQ closed near the low of the bar. Strong selling at a recent low became bullish when NQ closed near the high. The response appeared quickly and did not remain statistically clear at longer horizons.
The footprint’s most useful feature was not a colored stack. It was evidence that one side spent aggressively and got very little for it.
Methodology
The analysis used active front-month NQ quarterly contracts from NQH25 through NQU26. Contracts rolled on the Thursday before quarterly expiration. The sample covered 414 regular sessions from December, 2024 through July, 2026.
Raw Sierra Chart Denali records were aggregated by five-minute interval and 0.25-point traded-price level. Bid volume represented trades classified at the bid; ask volume represented trades classified at the ask. The regular session was 9:30 a.m.–4:00 p.m. Eastern Time.
The study produced 1,760 accepted rolling-extreme price-rejection events across 410 sessions after applying a six-bar cooldown. Outcomes were measured from the opening trade of the next bar through the close, high, and low of the next one, three, or six bars.
Confidence intervals used 2,000 fixed-seed bootstrap samples clustered by session. Full definitions, event-level outputs, and reproducible code accompany the article.
Futures trading involves substantial risk and is not suitable for every trader. This analysis is educational and is not individualized investment advice.