November 1, 2025
Order Flow vs Volume Profile: What’s the Difference?
Introduction
Many new traders get confused about order flow and volume profile because both deal with trading volume, yet they visualize it in different ways. These terms often pop up in trading discussions (along with market profile, a related concept), but it’s not obvious how they differ. Think of it this way: order flow is like watching a battle in real time, while volume profile is like studying the battlefield after the fact to see where the biggest fights took place. Both tools are valuable, but they serve different purposes in a trading strategy. In this post, we’ll break down what each one is, how they work, their key differences, and when to use them – all in plain English.
What Is Order Flow?
Order flow refers to the actual buy and sell orders flowing through the market in real time. In simple terms, it’s the process of analyzing who is buying or selling, at what prices, and in what quantities, as it happens. Order flow analysis lets traders see the volume of buyers vs. sellers at each price and time – information you can’t get from a normal candlestick chart alone[1][2]. By observing this flow of orders, traders try to gauge supply and demand dynamics moment by moment.
Tools Used for Order Flow: Traders use specialized tools and charts to visualize order flow data:
- Footprint Charts (Numbers Bars): A footprint chart displays executed buy and sell volume inside each price bar. Instead of a plain candle, you see numbers at each price level of the bar, typically green numbers for buy (ask) volume and red for sell (bid) volume. This lets you peek “inside” the bar to see how much was bought vs. sold at each price. For example, a footprint chart might show that at the price \$100, there were 500 contracts bought and 300 sold in that bar, revealing an imbalance in buying pressure. It essentially shows buying and selling pressure at specific price levels inside each candle[3], offering deeper insight than traditional charts.
- DOM (Depth of Market) / Order Book: The DOM is a list of pending orders (limits) to buy or sell at different prices. It shows liquidity waiting in the market – e.g. you might see there are 100 buy orders at \$99 and 120 sell orders at \$101, etc. While the DOM shows current resting orders, it’s part of order flow since it reflects supply/demand at each price. Traders watch the DOM for clues like large buy orders appearing (potential support) or being pulled. It’s another way to visualize the “order flow” beyond just executed trades.
- Delta (Volume Delta): Delta measures the difference between buying and selling volume. For instance, if at a given time 1,000 contracts were bought at market and 800 sold, the delta is +200. Delta can be shown per bar (bar delta) or cumulatively. A positive delta means more aggressive buyers (market buy orders) lifted the offer, while a negative delta means more sellers hit the bid. Delta is a quick gauge of who’s in control – buyers or sellers – during that period[4]. Many footprint charts highlight delta for each bar or even each price level.
How Traders Use Order Flow: Order flow gives very granular, real-time information. Traders use it to see buying or selling pressure unfolding and to time their entries/exits with precision. For example, imagine price is approaching a support level. A trader watching order flow might see on the footprint chart that as price hits the support, a surge of green numbers (buy orders) comes in at that level, indicating buyers are defending it. This could be a signal to go long, as it shows aggressive buyers stepping in. Conversely, if they see an excess of red numbers (sell volume) hitting the bids at a resistance level, it indicates selling pressure and a possible reversal down. In short, order flow trading is about reading the real-time auction between buyers and sellers. An excess of ask-side volume (buyers lifting offers) suggests strong buying interest, whereas excess bid-side volume (sellers hitting bids) signals selling pressure[5]. By monitoring these imbalances, traders can identify who’s winning the battle at key moments and make trading decisions accordingly.
Example: Let’s say an important news release just came out and the market is volatile. A scalper using order flow might zoom into a footprint chart on a 1-minute timeframe. They notice that each time price ticks up, delta is strongly positive (more buying volume) and large buy orders appear on the DOM, showing buyers are in control. This real-time confirmation from order flow gives the trader confidence to ride the momentum for a quick long trade. If instead they saw big sell orders absorbing every push up (large offers that don’t budge and a delta that turns red despite rising price), it would warn that sellers are absorbing the buying, a clue the rally might stall or reverse. In this way, order flow acts like an X-ray into the candle, revealing the intent behind price moves.
What Is Volume Profile?
Volume Profile is a charting tool that shows how volume is distributed across price levels over a given time period. Instead of volume by time (like the usual volume bars at the bottom of a chart), volume profile plots volume by price. It appears as a horizontal histogram on the side of your chart, indicating the total trading volume at each price level. In other words, it answers the question: “At what prices did the most trading occur?” during a session or timeframe[6].
On a volume profile chart, you’ll typically see a series of horizontal bars of varying length aligned with price levels on the vertical axis. Longer bars mean more volume traded at that price. This helps identify price levels of high activity (where lots of trades happened) versus low activity (few trades). Traders use these to infer important support/resistance zones, because heavy volume areas show prices that many market participants agreed on (fair value), whereas low volume areas show prices that were quickly rejected.
Some key concepts and terms in volume profile include:
- Point of Control (POC): The price level that had the highest traded volume in the period. This is the longest bar on the volume profile. The POC is often called the “fairest price” or a magnet level, because it’s where buyers and sellers did the most business (a price both sides found acceptable)[7]. Price often gravitates toward or bounces around the POC.
- Value Area (VA): The range of price levels around the POC that encompasses about 70% of the total volume for the period. Specifically, you’ll see Value Area High (VAH) and Value Area Low (VAL) markers, which are the upper and lower bounds of that 70% volume range. This value area represents where the market spent most of its time trading, essentially the core trading range or “fair value” zone for that session[8]. Prices outside the value area might indicate the market is moving into less accepted territory (potential breakout or rejection zones).
- High Volume Nodes (HVN): These are price levels (or zones) on the profile with significantly high volume – often they appear as peaks or bulges in the profile. HVNs often act as support or resistance levels because they indicate strong interest (lots of trading happened there)[9]. When price revisits an HVN, it may slow down or consolidate as trading activity picks up again.
- Low Volume Nodes (LVN): These are the opposite, price areas with very low traded volume (valleys or dips in the profile). LVNs suggest that the market did not spend much time there, often because price was rejected quickly. An LVN can act like a gap or “air pocket” – when price enters an LVN zone, it might move through it quickly since there isn’t much historical interest in that area[9]. Traders watch LVNs as potential breakout points; once price moves into a low-volume zone, it may travel to the next high-volume area with relatively little friction.
In essence, the volume profile gives you a bigger-picture view of volume distribution. For example, a day’s volume profile might reveal that most volume was transacted between \$50–\$55 (the value area) with a POC at \$52, indicating a strong base of trading there. If the price is currently above or below that range, it tells you something about market context (e.g., price above the value area might mean an upward trend or price discovery is happening above yesterday’s fair value). Volume profile is great for identifying key price levels – support and resistance zones based on actual traded volume rather than just previous highs/lows.
Key Differences Between Order Flow and Volume Profile
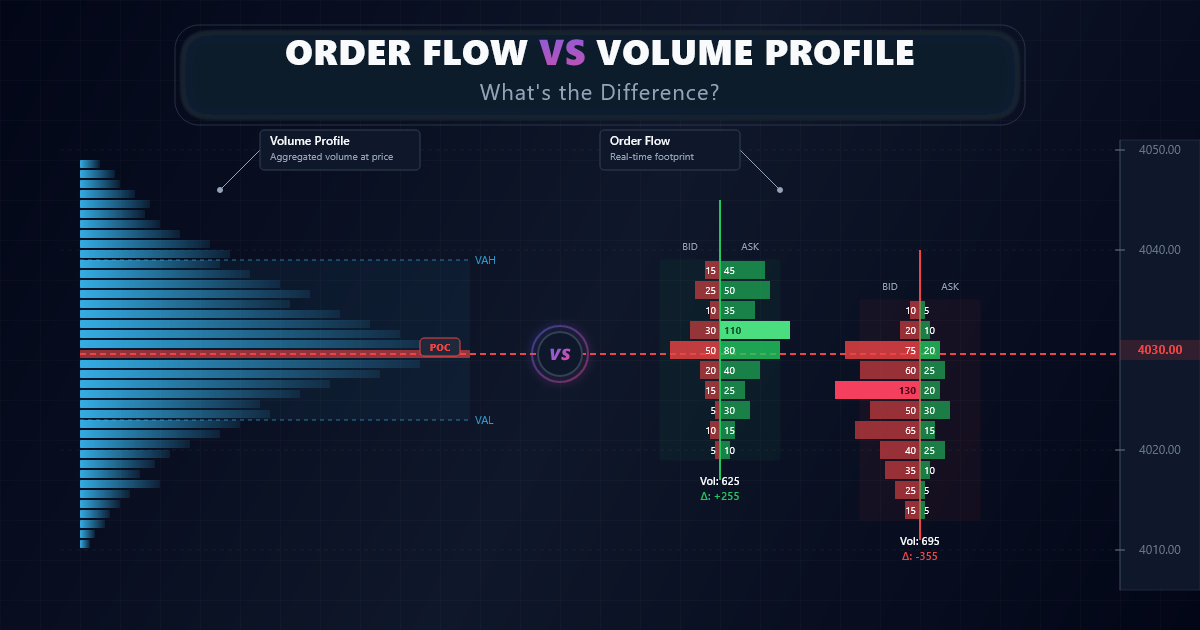
Above: A simplified visual comparison between a footprint chart (order flow) and a volume profile. The footprint chart on the left shows executed buy/sell volumes inside each candlestick (volume by time and price), whereas the volume profile on the right aggregates total volume at each price level over a chosen period.
Both order flow and volume profile deal with volume, but they focus on different dimensions of market activity[10]. Order flow zooms in on the immediate details – it’s extremely time-sensitive and shows each increment of buying and selling as it happens. Volume profile zooms out to show the overall landscape of volume – it’s about where heavy trading occurred over a longer period, not the exact sequence of trades. In other words, order flow is micro (per tick or per bar) and volume profile is macro (across many bars).
Another way to put it: order flow is like reading the tape of each trade (who’s punching in orders right now), whereas volume profile is like reading a map of historically important price levels. Order flow tools (like footprint charts) will tell you “buyers just absorbed 1000 contracts at \$2500 in this 5-minute candle,” while a volume profile will tell you “over the whole day, \$2500 was the most traded price (POC).” Both are volume-based insights, but at different scales and for different purposes.
Here’s a quick comparison of the two:
| Aspect | Order Flow (Footprint/Order Book) | Volume Profile |
|---|---|---|
| Time Sensitivity | Very high – focuses on the real-time flow of orders and tick-by-tick events. Ideal for short-term decisions (scalping/day trading). | Lower – focuses on accumulated volume over a session or period. Used for broader context and longer-term levels (swing trading).[11] |
| Detail Level | Granular detail of each price within each bar (who bought/sold, how much at each price). Micro view of market activity. | Aggregated view of volume by price. Doesn’t show individual trades, but highlights macro-level volume patterns (high vs low volume areas).[12] |
| Chart Type | Footprint charts, DOM, tape, etc. Often displayed as numeric data inside candlesticks or ladders (needs advanced platform). | Horizontal histogram overlaid on a normal price chart (or side panel). Can be applied to any chart timeframe to show volume distribution. Easy to visualize key levels at a glance. |
| Primary Use / Purpose | Timing entries and short-term trade management. Order flow trading helps identify immediate shifts in supply/demand (e.g. spotting aggressive buying or selling) for precise entry/exit. [13] | Identifying support/resistance and overall market structure. Volume profile trading is used to find value areas, important price zones, and to gauge if price is in balance or exploring new territory. Great for trade planning and context.[13] |
Table: Comparison of Order Flow vs. Volume Profile.
As the table shows, order flow provides tick-by-tick, high-detail insight, whereas volume profile provides big-picture context. If you’re a fast-paced day trader or scalper, the real-time detail of order flow can help with precision timing, letting you see inside each candle before you act. If you’re a swing trader or someone looking for major support and resistance levels, volume profile makes it easier to spot those price zones where lots of trading happened (which often correspond to important decision points in the market).
It’s worth noting that complexity is also a differentiator. Order flow tools like footprint charts come with a steeper learning curve and can be information-heavy – there’s a lot of data streaming at once, which can overwhelm beginners. Volume profile, on the other hand, is relatively easier to interpret at a glance[14]. You can look at a profile and quickly identify the POC or value area without needing to decode a matrix of numbers. For this reason, many new traders start with volume profile to get a sense of market structure, and then gradually incorporate order flow analysis as they become more comfortable.
When to Use Each Tool
So, should you use order flow, volume profile, or both? The answer often depends on the context and your trading style. In practice, many traders use both together to complement each other[15]. Here are some scenarios and guidelines to illustrate when each tool shines:
- Using Volume Profile for Context: Volume profile is excellent for contextual analysis. Before the trading day (or before entering a trade), you might look at the volume profile of the previous day or week to identify key levels. For example, suppose yesterday’s profile shows a strong high-volume node around \$2500 – this was a price where a ton of volume traded, indicating a potential support/resistance. It also shows an LVN at \$2525-2530, a pocket where volume dropped off (perhaps a quick move happened there). As you plan today’s trades, you’ll mark \$2500 as a major level (maybe a point of control or value area low) and \$2525-30 as a zone where, if the market enters, it might move swiftly to the next high-volume area. In this way, the volume profile gives you a road map of important prices to watch. Swing traders especially use volume profiles on daily/weekly charts to find zones to enter on pullbacks or take profits, since it visualizes long-term support and resistance derived from actual traded volume.
- Using Order Flow for Entry Timing: Order flow comes into play when you’re ready to pull the trigger on a trade or manage an active position. Once you’ve identified an interesting price level or setup (maybe using volume profile or other analysis), zoom into the order flow to see what’s happening right now. For instance, imagine price is approaching that \$2500 support level we identified. As it touches \$2500, you switch to a footprint or DOM view. You might see large buy orders appearing on the bid and aggressive market buys hitting the tape – a sign that buyers are defending the level (bullish signal). You also notice the delta turns positive as price hits \$2500, confirming buyers are more aggressive at that moment. This real-time confirmation from order flow gives you confidence to go long at the level, since it shows the battle is leaning in the buyers’ favor. Alternatively, if you saw the opposite (huge sell orders absorbing all buys, delta going deeply negative), you’d think twice – the order flow would be indicating a likely breakdown through the level. In summary, order flow trading is often used for trade entry/exit decisions and short-term adjustments, because it shows immediate shifts in buying or selling pressure that aren’t visible on higher-level charts.
- Combining Both for a One-Two Punch: Volume profile and order flow are not mutually exclusive – in fact, they complement each other extremely well. A common approach is: use volume profile to identify where to trade, and order flow to decide when to trade. The volume profile gives you the areas of interest (the “battlefield”), and the order flow tells you what’s happening in the heat of the moment (the “battle”). For example, a trader might use the daily volume profile to determine that today’s price is nearing yesterday’s value area high (a potential resistance). Rather than blindly shorting there, they wait and watch the footprint chart as price reaches that level. If they see sellers indeed start to dominate in the order flow (e.g. big red volumes on the footprint, lots of market sell orders coming through), it validates the idea and they execute a short. If they don’t see selling pressure on order flow (perhaps buyers keep absorbing and delta stays green), they may hold off, as the level might break. In this way, volume profile provides the setup and bias, while order flow provides the trigger or confirmation[15].
Pro Tip: Don’t get overwhelmed by these tools. It’s often best to start with one tool and get comfortable before combining them. For instance, you might begin by using volume profile on your charts to mark out key levels and observe how price behaves around high-volume areas. Once you’re proficient with that, gradually introduce an order flow tool like a footprint chart in a simulator or replay mode. Practice reading the order flow around those key levels. Over time, you’ll build the skill to use both in tandem. Remember that the goal is to enhance your understanding and timing – if a tool is confusing you or causing “analysis paralysis,” simplify your approach. Master the basics of volume and price action first, then layer on the detailed order flow analysis.
Conclusion
In the debate of order flow vs. volume profile, it’s not about which is universally “better” – it’s about what each tool is better for. Order flow (through footprints, DOM, etc.) gives you an unparalleled real-time look at market aggressors and immediate supply/demand, which is powerful for short-term trading and precise entries. Volume profile gives you a bird’s-eye view of where trading has clustered – invaluable for identifying support/resistance and understanding the market’s structure and bias.
For beginners, volume profile is often the easier starting point. It’s visually intuitive and won’t overload you with data. You can quickly spot important levels and get a sense of the market’s context using volume profiles. Once you’ve grasped those concepts, order flow trading can be introduced to refine your timing. If you dive straight into order flow without context, you might find it overwhelming (imagine staring at a matrix of numbers and rapid order book changes without knowing what to make of it). Instead, anchor yourself with the bigger picture first.
Ultimately, you don’t have to choose one or the other forever – they serve different purposes and work best in combination. Many successful traders use volume profile to find high-probability areas and order flow to execute with confidence at those areas. Think of volume profile as identifying “where the market’s interest lies” and order flow as confirming “what the market participants are doing right now.” By using the right tool for the right job, you gain a more complete view of the market.
Next Steps
Now that you understand the difference between order flow and volume profile, you might be curious to see these tools in action. A great next step is to learn more about footprint charts and order flow setups on a trading platform. For instance, platforms like Sierra Chart or NinjaTrader (with Order Flow add-ons) allow you to display footprint charts and volume profiles side by side[16]. You could start by applying a volume profile to recent market data and noting the key levels, then use a replay or live simulation to watch a footprint chart around those levels. Practice reading the signs: Who’s dominating at a given moment? How does price react at high-volume vs. low-volume nodes? There are also many online tutorials and communities focused on order flow trading – consider checking out those resources for hands-on tips. By incrementally building your skills with these tools, you’ll become more confident in understanding the story behind price movements. Happy trading, and remember to keep it simple as you begin: volume tells the story of where interest is, and order flow tells the story of who is winning in the moment – together, they can give you a clearer edge in the market.
References
- Order Flow Trading – Wikipedia
- The Ultimate Guide To Order Flow Trading Analysis | CTI
- Footprint Charts vs Volume Profile: Which Trading Tool Wins? | QuantVPS
- Volume Footprint Charts: Ultimate Guide to Reading Order Flow (2025) — Mind Math Money
- Defining the Footprint Chart (2025): How to Analyze Market Depth