July 4, 2026
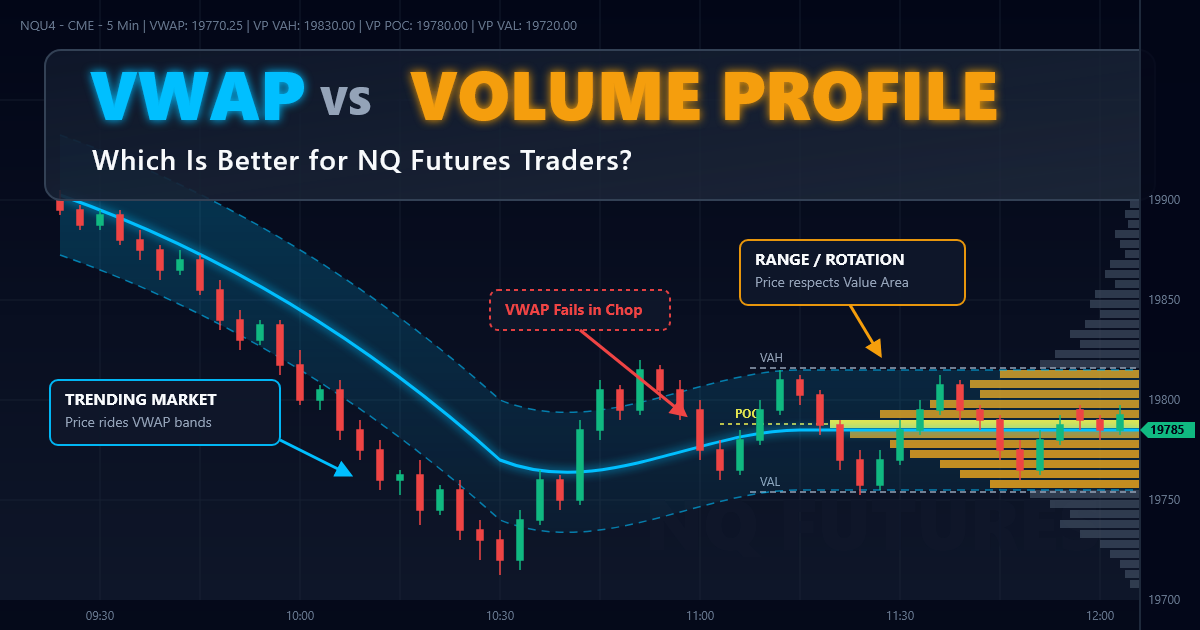
VWAP vs Volume Profile: Which Is Better for NQ Futures Traders?
VWAP and Volume Profile are two of the most popular institutional tools on a Sierra Chart futures workspace, but they do not answer the same question.
VWAP tells you where price is trading relative to its volume-weighted average. Volume Profile tells you where the market accepted trade.
NQ can trend cleanly for hours, then rotate violently around a prior value area. Treating VWAP as automatic support or every profile level as a fade point is how good tools become bad trades.
The practical question is simple: When should you rely on VWAP, and when should you rely on Volume Profile?
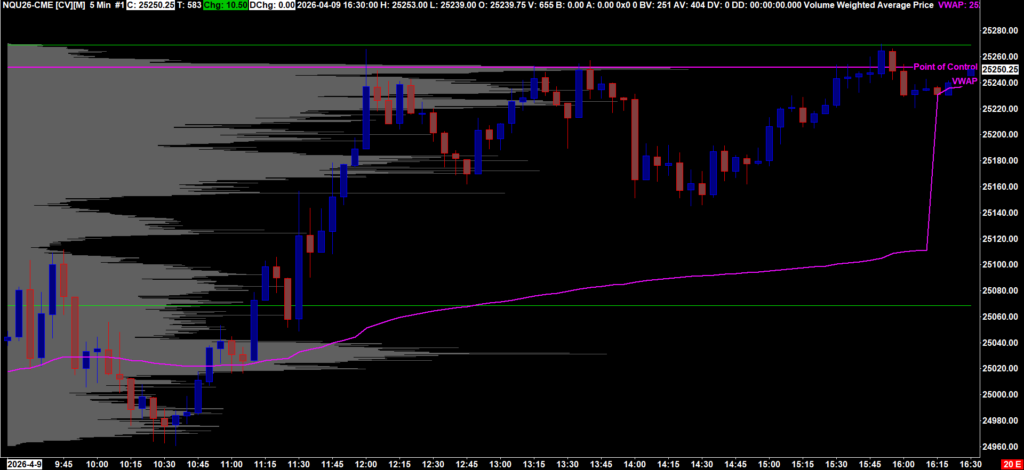
Figure 1: Sierra Chart VWAP context, April 9, 2026.
What VWAP Shows
VWAP is the average traded price weighted by volume. In practice, it is an execution benchmark. Institutions care whether they are buying above or below the session’s volume-weighted average. Intraday traders care because VWAP often marks bullish or bearish session control.
When NQ is above VWAP and holding pullbacks, buyers are paying above the session’s average price. That does not guarantee continuation, but sellers have not yet forced the market back into balance. Below VWAP, the same logic applies in reverse.
A practical example: NQ opens strong, drives higher for 30 minutes, and remains above VWAP. Instead of buying the breakout high, a better trade is often to wait for a pullback. If price tags VWAP, probes below it, and then reclaims it, the entry has structure and the invalidation is clear.
VWAP is most useful for mean reversion back toward fair intraday price, then trend continuation if that fair price holds.
What Volume Profile Shows
Volume Profile shows where volume traded by price, not by time. It answers a different question: where did the market accept value?
The key levels are straightforward. The Point of Control is the price with the most volume. The Value Area is the range where most volume traded, commonly 70%. High Volume Nodes show accepted value. Low Volume Nodes show thin areas where price moved quickly.
In NQ, this matters because price often reacts sharply when it moves from one accepted area into another. If NQ builds volume around 20,150, that area matters later. A rally into that node may stall if buyers cannot reclaim it. If price holds above it, the same area can become support. Once NQ breaks into a Low Volume Node, it can move quickly toward the next high-volume area.
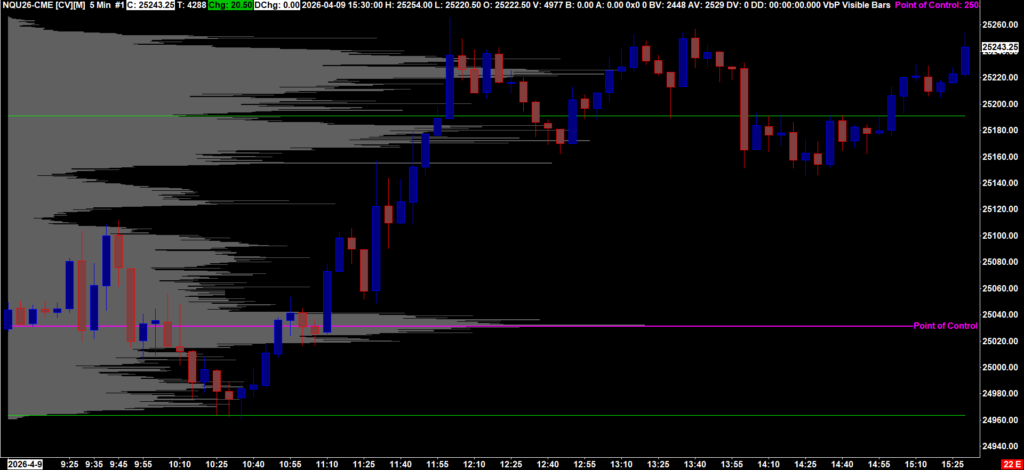
Figure 2: Sierra Chart Volume by Price with POC and value area.
VWAP vs Volume Profile
| Category | VWAP | Volume Profile |
|---|---|---|
| Purpose | Measures the session’s volume-weighted average price | Shows where trading occurred by price |
| Best market condition | Trend days, clean directional bias, structured pullbacks | Rotational days, balance breaks, reversals around accepted value |
| Best entries | Pullbacks to VWAP in the direction of session bias | Rejection or acceptance at POC, value edges, HVNs, and LVNs |
| Weaknesses | Gets chopped up when price rotates tightly around the mean | Creates too many levels if used without context |
| Typical users | Execution traders, intraday trend traders, systematic traders | Auction market traders, reversal traders, discretionary futures traders |
Which Works Better?
Neither tool is universally better. The better tool is the one answering the current market question.
Use VWAP when trading trend continuation, looking for intraday bias, or waiting for pullbacks. If NQ opens above VWAP and keeps making higher lows, VWAP is a clean reference for buyer control. In that environment, fading every rally can be expensive.
Use Volume Profile when trading reversals, finding support and resistance, or identifying acceptance and rejection. If NQ is rotating between prior value high, POC, and value low, the profile gives better structure.
The mistake is using either tool in isolation. VWAP gives you session bias. Volume Profile gives you the auction map.
Practical Sierra Chart Example
Imagine a normal NQ regular session in Sierra Chart. Price opens with an aggressive drive above VWAP. The first 30 minutes show strong buying, and pullbacks stay shallow. The developing profile shows the early POC below the current market.
That tells you two things. First, session bias is bullish. Second, the heaviest early trade is still below, so the market has not fully built value at higher prices.
Now NQ pulls back into VWAP. Buying automatically because VWAP is “support” is not enough. A better trader watches whether sellers can accept below it. If price fails under VWAP and quickly reclaims it, sellers had a chance to shift control and failed.
Next, suppose price pushes above the Value Area High and holds there. That is acceptance above value. VWAP and Volume Profile are now aligned: VWAP shows bullish bias, while the profile shows acceptance above value.
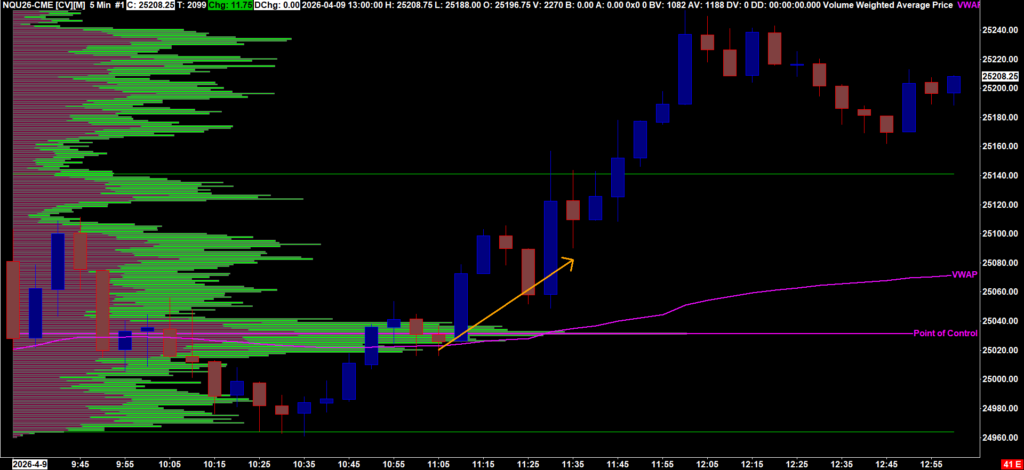
Figure 3: Combining VWAP bias with profile acceptance.
A practical long trade could be taken after the VWAP reclaim, especially if price also holds above the Value Area High. Risk can sit below the failed VWAP break. Targets can be the next high-volume node, prior session high, or a measured extension.
Optional Original Insight
One simple statistic from Sierra Chart exports makes this more useful than a textbook comparison.
Using NQ OHLC Data, a qualified RTH session had at least 70 five-minute bars from 09:30 to 16:00. An opening drive was any first 30-minute move of at least 50 NQ points from the RTH open. A VWAP revisit occurred when any later bar traded through session VWAP.
Under that rule, the file contained 319 qualified sessions. Of those, 192 had an opening drive, and 180 revisited VWAP later in the session. That is a 93.8% revisit rate in this sample.
This does not mean traders should blindly fade the opening drive. It means VWAP is often revisited, so traders should plan for the possibility of a pullback before chasing extension.
Conclusion
VWAP tells you whether price is trading above or below the session’s volume-weighted fair price. It is best for intraday bias, pullbacks, and trend continuation.
Volume Profile tells you where the market accepted value. It is best for identifying POC, value areas, high-volume nodes, low-volume nodes, and acceptance or rejection.
Professional futures traders combine both. VWAP tells you whether price is fair. Volume Profile tells you where the market agreed on value. For NQ traders using Sierra Chart, that combination is more practical than choosing one tool for every condition.