May 27, 2026
Intel (INTC) Technical and Fundamental Analysis | May 2026
Overview
Intel ($INTC) has stopped trading like a slow legacy semiconductor company and started trading like a high-beta turnaround story. The setup is now built around three overlapping narratives: AI infrastructure relevance, a manufacturing comeback through Intel 18A, and the possibility that Intel Foundry becomes a strategically important U.S.-based alternative to Asian leading-edge capacity.
That combination has produced a massive move in the stock. IBKR’s latest daily bar dated May 27, 2026 shows INTC up 491.0% over the trailing year, with the shares still only 7.0% below their rolling high. The technical trend is strong, but the stock has already priced in a lot of operational improvement.
This article takes a dual approach: first, the live technical picture from IBKR; then the fundamental thesis, using Astreka’s January article as the baseline and the newer June update as the current market framing.
Live Technical Data (via IBKR API)
As of latest IBKR daily bar dated May 27, 2026
| Indicator | Value |
|---|---|
| Last Close | $120.38 |
| SMA 20 | $112.78 |
| SMA 50 | $79.49 |
| SMA 200 | $48.19 |
| RSI (14) | 55.8 |
| MACD | 11.5372 |
| MACD Signal | 12.7638 |
| BB Upper | $133.51 |
| BB Lower | $92.05 |
| 1-Year Return | +491.0% |
| Current Drawdown | -7.0% |
| Max 1-Year Drawdown | -24.2% |
| Trend | BULLISH |
| RSI Signal | Neutral |
Data fetched via the
ib_insyncPython library connecting to Interactive Brokers. Historical bars used: 1-year daily OHLCV.
What the Chart Is Telling Us
OHLC Price & Volume
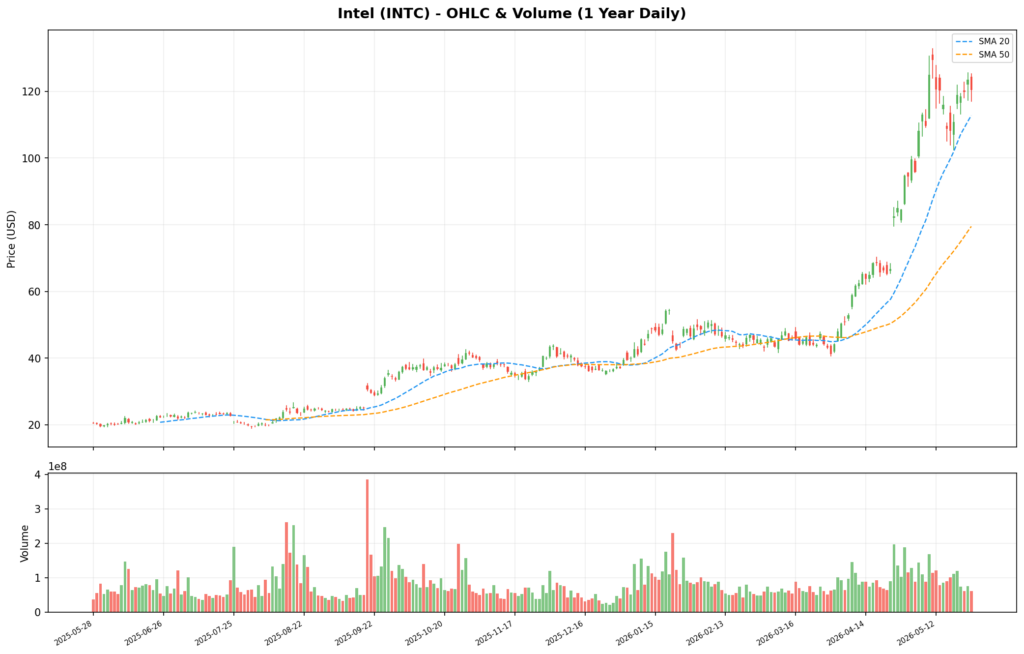
Green bars = up days, red bars = down days. Blue/orange dashed lines are SMA 20/50.
Trend: Still Bullish, But No Longer Early
The moving average stack is cleanly bullish: SMA 20 > SMA 50 > SMA 200. That tells us the rally is not just a short-term spike. The stock is above the short-, medium-, and long-term averages at the same time, which usually reflects broad participation rather than a single news-driven move.
The more important detail is the distance between those averages. INTC closed at $120.38, compared with a 20-day average of $112.78, a 50-day average of $79.49, and a 200-day average of $48.19. That is a powerful trend, but it also shows how far the stock has moved from its longer-term base. A pullback toward the 20-day average would be normal. A deeper retest of the 50-day would still leave the longer-term trend intact.
RSI, MACD & Bollinger Bands
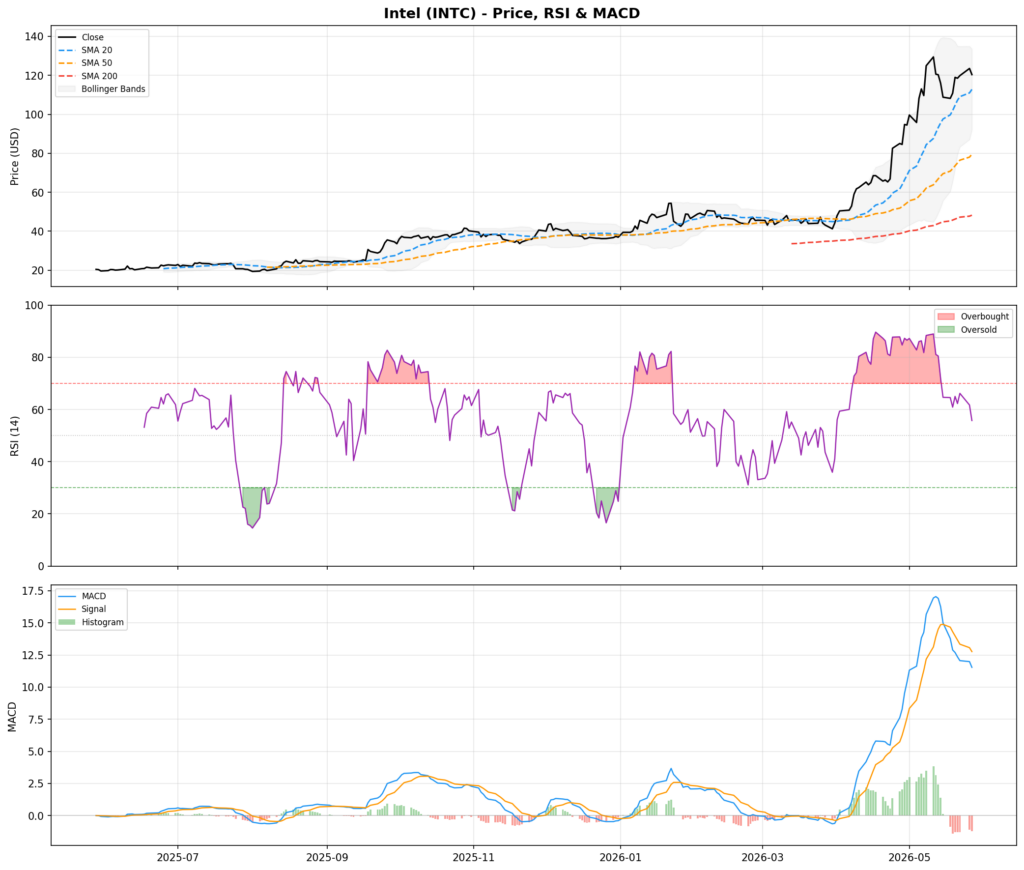
The RSI is 55.8, which is neutral. That matters because the stock has already run almost 5x over the last year, yet the latest daily RSI is not overbought. Momentum has cooled from the most aggressive part of the rally, but it has not broken.
MACD is more cautious. The MACD line is 11.5372, below the signal line at 12.7638. That does not negate the larger uptrend, but it suggests near-term momentum has softened. In plain English: the trend is still bullish, but the stock may need consolidation before another clean leg higher.
Bollinger Bands: Room, But Not Cheap
INTC is trading below the Bollinger upper band of $133.51 and above the 20-day midpoint near $112.78. That gives the stock some upside room before it looks statistically stretched again, but the lower band at $92.05 shows how wide the volatility range has become.
For traders, that means position sizing matters. A stock can be technically bullish and still carry sharp downside swings when volatility expands this much.
Technical Summary
Trend: Bullish
Momentum: Positive, but cooling
Short-term risk: Moderate – MACD has softened and volatility is wide
Support levels to watch: $112.78 (SMA 20), $92.05 (lower Bollinger Band), $79.49 (SMA 50)
Upside level to watch: $133.51 (upper Bollinger Band)
1-Year Performance & Drawdown
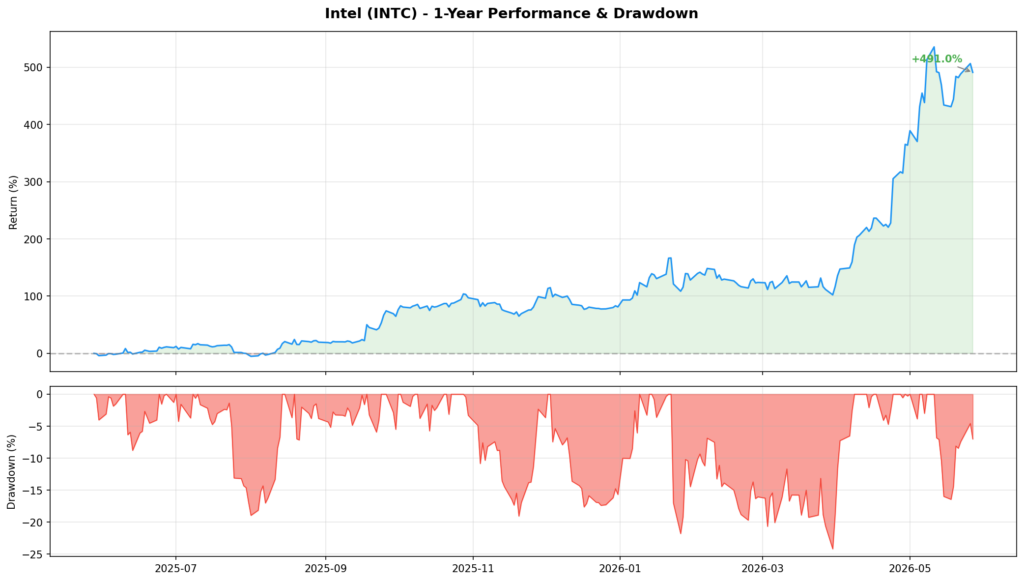
INTC’s trailing 1-year performance is extraordinary: +491.0%. The current drawdown is only -7.0%, while the max drawdown over the same period was -24.2%. That combination tells us investors have been consistently buying pullbacks rather than using strength to exit.
The question now is not whether momentum has existed. It clearly has. The question is whether the fundamentals can keep catching up to a stock that has already moved this far.
What Is Driving Intel Fundamentally
1. AI Infrastructure Optimism
The newer Intel update frames the current rally around a simple market belief: Intel may be regaining relevance in AI infrastructure. That does not mean Intel is suddenly competing with NVIDIA on GPUs. The more realistic bull case is that Intel can remain essential in the AI server stack through Xeon CPUs, custom server products, AI PC silicon, and foundry partnerships.
This is why the stock has started acting more like a speculative AI beneficiary than a mature PC/server CPU vendor. Investors are not only paying for current earnings. They are paying for a possible role in the next AI infrastructure cycle.
2. The Turnaround Under New Leadership
Astreka’s January reference article described Intel as a company that had already begun to reset investor expectations after years of execution problems. The core elements were leadership change, cost discipline, a narrower operating focus, and a renewed attempt to rebuild manufacturing credibility.
The June update suggests the market has leaned further into that reset. Intel is now being treated less like a declining incumbent and more like a turnaround with optionality. That is a better narrative, but it also raises the bar. Once the market shifts from “survival” to “revival,” good news becomes expected.
3. Intel 18A Is The Main Proof Point
The most important operating issue remains Intel 18A. Astreka’s January article identified Panther Lake and Core Ultra Series 3 as key proof points for Intel’s manufacturing comeback. Those chips matter because they are built on Intel 18A and represent the company’s attempt to show that its process roadmap is no longer just a promise.
The June update keeps 18A at the center of the story. Bulls want to see Intel execute on advanced nodes, attract external foundry customers, and narrow the technology gap with TSMC. If 18A ramps well, it supports both the product business and the foundry thesis. If yields, costs, or customer commitments disappoint, the stock’s new valuation can compress quickly.
4. Foundry Is The Biggest Long-Term Swing Factor
Intel Foundry is the part of the thesis with the largest possible payoff and the largest execution burden. Astreka’s January article emphasized that Intel is trying to transform manufacturing from an internal cost center into a foundry platform serving external customers.
The strategic logic is clear:
- U.S. and European governments want more domestic advanced chip capacity.
- Fabless chip companies want supply-chain alternatives to Taiwan concentration.
- Intel needs outside volume to justify the enormous capex behind leading-edge fabs.
- A credible foundry business could make Intel more valuable than a pure CPU turnaround would.
The problem is that foundry customers do not buy narratives. They buy yield, reliability, cost, design support, and delivery discipline. Intel has to prove it can behave like a world-class foundry operator, not just a world-class chip designer.
5. Q1 2026 Helped The Bull Case
The June update also points to a better-than-expected Q1 2026 report. Revenue and adjusted EPS beat expectations, and the stock reacted strongly. That kind of earnings surprise matters because it gives investors evidence that the turnaround is not only a product roadmap story.
Cost cuts and restructuring can improve near-term earnings power, but they are not enough on their own. The market needs to see that revenue, margins, and customer demand can all improve together. Q1 appears to have strengthened that belief.
Valuation: The Stock Is Now Priced For Execution
The technical data makes the valuation debate unavoidable. A 491.0% 1-year move means the easy part of the re-rating has already happened. The stock is no longer priced like investors assume Intel is broken. It is priced like investors believe the turnaround is real.
That creates a more balanced risk/reward. The upside case is still meaningful if Intel executes on 18A, converts AI/data-center optimism into revenue, and signs enough foundry business to make the manufacturing strategy economically credible. In that scenario, the market could keep assigning Intel a higher multiple because the company would no longer be viewed as just a cyclical CPU vendor.
The downside case is equally clear. If the rally is mostly multiple expansion and the operating results fail to follow, the stock can fall hard without the company necessarily “failing.” For a stock up nearly 5x, even modest disappointment can matter.
Key Risks
| Risk Factor | Why It Matters |
|---|---|
| 18A execution | Yield, cost, and volume ramp determine whether the manufacturing comeback is real |
| Foundry customer traction | Intel needs external customers to justify the foundry capex story |
| AI GPU weakness | Intel may benefit from AI infrastructure, but NVIDIA remains dominant in accelerators |
| AMD server pressure | AMD can still pressure Intel’s most profitable CPU markets |
| TSMC competition | Foundry credibility requires performance, cost, and reliability at elite levels |
| Heavy capex | Fab investment can strain free cash flow if growth arrives slower than expected |
| Valuation compression | After a 491.0% 1-year move, the stock has little patience for execution slips |
| Geopolitical exposure | Government support helps, but semiconductor policy and China exposure add complexity |
Bottom Line
INTC’s technicals and fundamentals are telling a coherent but demanding story: the turnaround is real enough for the market to reward it, but the stock has already moved far ahead of the old Intel narrative.
From a technical standpoint, the trend is still bullish. The moving averages are aligned, the stock remains near its highs, and RSI is neutral rather than overheated. The caution flag is MACD, which has softened, and the huge gap between the current price and the 50-/200-day averages. This is not a broken chart, but it is no longer an early chart.
From a fundamental standpoint, the January Astreka thesis has mostly evolved in the bull direction: Panther Lake and 18A are now central proof points, foundry remains the biggest swing factor, and new AI infrastructure optimism has added fuel. The June update reinforces that investors are focused less on today’s earnings and more on whether Intel can become strategically important again.
Investment assessment:
| Factor | View |
|---|---|
| Long-term outlook | Constructive, but execution-dependent |
| Near-term technicals | Bullish trend, cooling momentum |
| Valuation | Priced for successful turnaround |
| Risk level | High |
| Best for | Investors comfortable with semiconductor cyclicality and execution risk |
Intel is one of the most interesting semiconductor stories in the market because the upside is tied to real strategic change, not just cost-cutting. But after a 491.0% trailing-year rally, the stock needs continued proof: 18A has to ramp, foundry has to win customers, data-center momentum has to persist, and margins have to support the story. The thesis is stronger than it was in January, but the margin for error is smaller.
Disclosure: This article is for informational purposes only and does not constitute financial advice. Technical data was sourced live via the Interactive Brokers API using the ib_insync Python library. Fundamental analysis referenced Astreka’s January 2026 Intel article (URL: https://www.astreka.com/stocks/intels-strategic-position-and-recent-developments-early-2026)