May 29, 2026
Micron (MU) Technical and Fundamental Analysis | May 2026
Technical data sourced live via the Interactive Brokers API (IBKR). Fundamental framing references our own January 2026 Micron article and revisits what that piece got right and wrong.
Overview
Micron Technology ($MU) has done something almost no analyst was modeling a year ago: it became a trillion-dollar company. At a latest close of $946.89, against roughly 1.12 billion shares outstanding, Micron’s market capitalization now sits just above $1 trillion — a milestone that puts the only U.S.-based memory manufacturer in the same valuation tier as the mega-cap platform companies it supplies.
The move has been staggering. IBKR’s latest daily bar dated May 29, 2026 shows MU up 902.4% over the trailing year, trading at a fresh all-time high (0.0% drawdown). A year ago the stock was changing hands near $95. The AI “memory supercycle” we described in January did not just continue — it went vertical.
We take a dual approach. First, the live technical picture from IBKR. Then the fundamental thesis: a scorecard on our January call, the bull case for why $1T might still be early, and — most importantly — the bear case, including the one structural risk most people are not pricing: what happens to memory demand if AI labs make their models dramatically more memory-efficient.
Live Technical Data (via IBKR API)
As of latest IBKR daily bar dated May 29, 2026
| Indicator | Value |
|---|---|
| Last Close | $946.89 |
| SMA 20 | $750.26 |
| SMA 50 | $557.08 |
| SMA 200 | $338.62 |
| RSI (14) | 68.7 |
| MACD | 99.9031 |
| MACD Signal | 85.0296 |
| BB Upper | $974.71 |
| BB Lower | $525.81 |
| 1-Year Return | +902.4% |
| Current Drawdown | 0.0% |
| Max 1-Year Drawdown | -30.3% |
| Trend | BULLISH |
| RSI Signal | Neutral (68.7) |
Data fetched via the
ib_insyncPython library connecting to Interactive Brokers TWS on live port7496. Historical bars used: 1-year daily OHLCV.
What the Chart Is Telling Us
OHLC Price & Volume
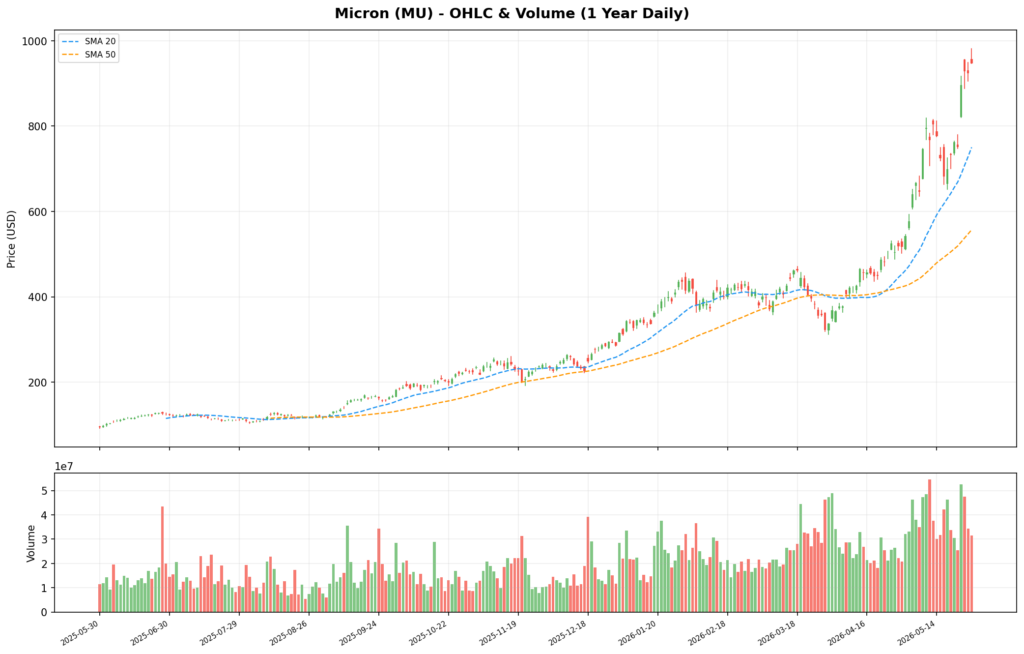
Green bars = up days, red bars = down days. Blue/orange dashed lines are SMA 20/50.
Trend: Powerfully Bullish — and Stretched
The moving average stack is textbook bullish: SMA 20 ($750.26) > SMA 50 ($557.08) > SMA 200 ($338.62). All three are rising, cleanly fanned out, and well separated. This is not a single news spike; it is a sustained, broad-participation uptrend that has held for the better part of a year.
But the same chart that confirms the trend also flashes how extended it is. The stock closed at $946.89 — roughly 26% above its own 20-day average, 70% above its 50-day, and nearly 180% above its 200-day. Trends this stretched from their longer-term base do eventually mean-revert, even inside a bull market. A pullback to the 20-day near $750 would be an ordinary breather; a retest of the 50-day near $557 would still leave the primary uptrend fully intact.
RSI, MACD & Bollinger Bands
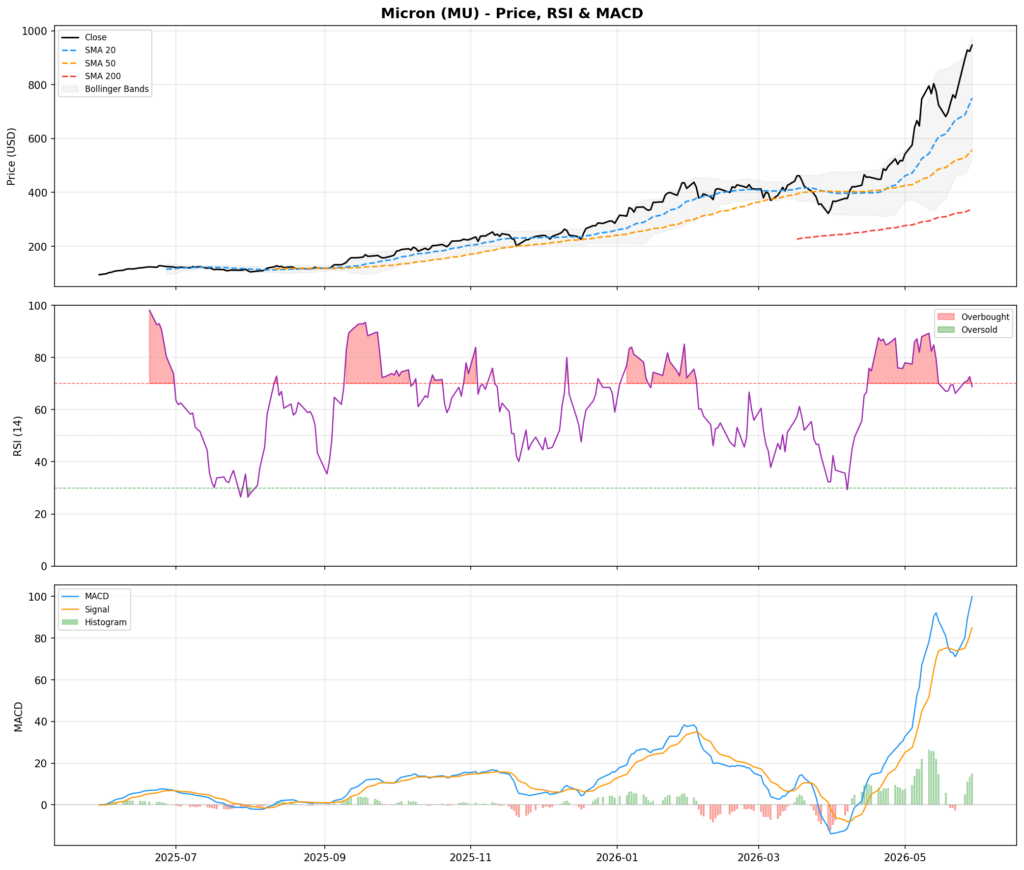
The RSI sits at 68.7 — technically “neutral” because it is a hair below the 70 overbought line, but that is splitting hairs. The stock is knocking on the door of overbought after a near-10x run. The honest read: momentum is still strong, but there is very little slack left before the chart is statistically hot.
MACD remains constructive. The MACD line at 99.90 is above its signal at 85.03, so near-term momentum is still positive and accelerating — a notable contrast to many extended names where MACD has already rolled over. The trend has not yet shown a momentum crack.
Bollinger Bands: Riding the Upper Rail
MU closed at $946.89 against a Bollinger upper band of $974.71. The stock is pressed right against the top of its volatility envelope, with the lower band all the way down at $525.81. “Riding the upper band” is what powerful trends do — but it also means the stock is priced for continued perfection in the very short term, and the $449 gap between the bands quantifies just how violent the two-way volatility in this name has become.
Technical Summary
Trend: Strongly bullish Momentum: Positive and still accelerating (MACD above signal) Short-term risk: Elevated — RSI near overbought, price pinned to upper Bollinger band, at all-time highs Support levels to watch: $750.26 (SMA 20), $557.08 (SMA 50), $525.81 (lower Bollinger Band) Upside level to watch: $974.71 (upper Bollinger Band)
1-Year Performance & Drawdown
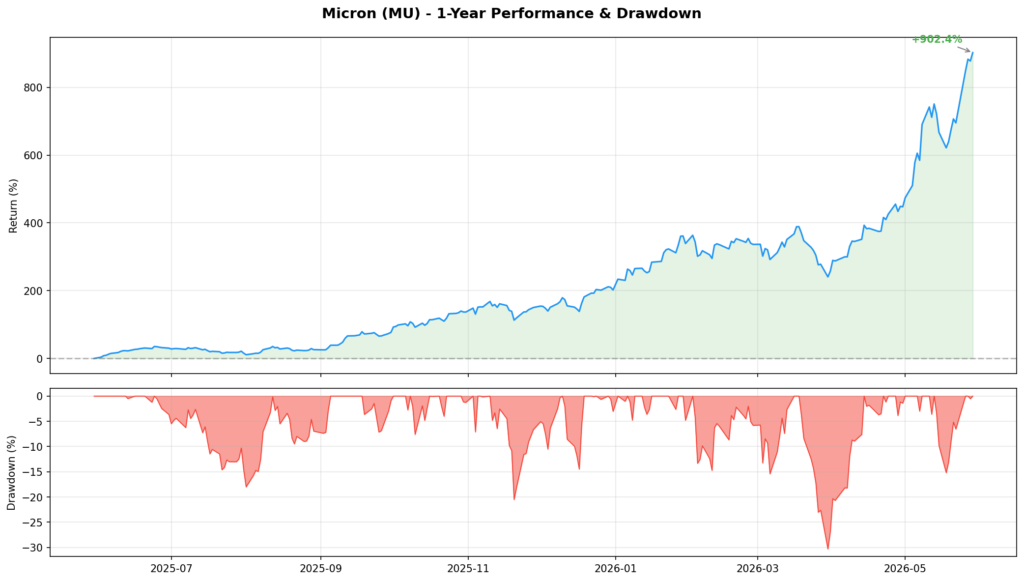
Micron’s trailing 1-year performance is +902.4% — a near-10x. The current drawdown is 0.0%, meaning the stock is sitting at its highest close of the entire window. Yet the path was not a straight line: the max drawdown over the same year was -30.3%. That detail matters. Even during this historic run, MU handed investors a 30% peak-to-trough decline along the way. Anyone treating this as a low-volatility compounder is misreading the chart.
The question is no longer whether momentum has existed — it clearly has, spectacularly. The question is whether the fundamentals can keep validating a trillion-dollar valuation that already assumes the memory supercycle runs for years.
Scorecard: What Our January 2026 Article Got Right and Wrong
We published a detailed Micron piece in January. With four months of hindsight, here is the honest grade.
What we got right ✅
- The core thesis — that the AI memory supercycle would persist — was correct, and then some. We argued Micron was in a structural seller’s market with pricing power, sold-out HBM, and multi-year tightness. All of that played out.
- “Effectively sold out” HBM through 2026. We flagged that Micron’s high-bandwidth memory was fully booked and that the company had walked away from low-margin consumer (the Crucial exit) to feed strategic AI customers. That allocation strategy held.
- Multi-year shortage. Our January note quoted Micron warning DRAM supply would stay tight “in any meaningful way before 2028.” Prices have stayed elevated, supporting that view so far.
- Pricing power and margin expansion. Gross margins in the 45–50%+ range and record cash generation continued.
What we got wrong (or badly underestimated) ❌
- We anchored to far-too-low price targets. In January we cited a Bank of America target of $300 as aggressively bullish, with the stock near $300–$400. MU is now at $946.89. The market repriced Micron roughly 2.5–3x beyond where even the bulls were pointing. We treated the consensus bull case as the ceiling; it was the floor.
- We framed it as “balanced risk/reward.” Our January conclusion hedged heavily toward cyclicality risk. In hindsight, that even-handedness underweighted the sheer velocity of AI capex and the operating leverage in memory. The bull case dominated.
- We did not anticipate the $1T milestone. A trillion-dollar memory company was simply not in our January framing. Memory had always been a “commodity” business that traded at low single-digit-to-low-double-digit multiples; the market has, at least for now, re-rated Micron as an AI infrastructure must-own.
- The cyclical “bust” we warned about hasn’t shown up — yet. Our biggest flagged risk (oversupply/glut by 2027–2028) remains a real future risk, but calling it prominently in January would have kept a reader out of a near-10x move.
The lesson: in January we correctly identified the direction but were far too conservative on magnitude, and we under-weighted how willing the market would be to abandon the “memory is a commodity” mental model. That same willingness is exactly what the bear case below puts back on the table.
The Bull Case: Why $1T Might Still Be Early
- AI demand is still compounding, and memory is the bottleneck. Every new generation of accelerators needs more HBM per GPU, and inference at scale (not just training) is now a structural, recurring memory consumer. Agentic AI — many models running long, parallel context windows — is memory-hungry in a way that compounds with adoption.
- HBM is no longer a commodity — it’s a designed-in, contracted product. HBM4 is sold under long-term agreements with pricing locked well in advance. This is the opposite of the spot-priced DRAM that historically whipsawed Micron’s earnings. The more of Micron’s mix that shifts to contracted HBM, the less “commodity” the business looks — which supports a structurally higher multiple.
- The “die penalty” keeps commodity DRAM tight, too. Because HBM consumes far more wafer area per bit, every wafer Micron pivots to AI memory removes a multiple of that capacity from the standard DRAM pool. That keeps even conventional DDR5/LPDDR5 prices elevated — Micron wins on both the premium and the commodity side simultaneously.
- Only U.S.-based memory maker + government tailwinds. The New York and Idaho megafabs, backed by CHIPS Act funding and state incentives, position Micron as the domestic-supply champion at a moment when supply-chain sovereignty is a national priority. That is a durable strategic moat peers can’t easily replicate.
- Momentum and earnings are still rising together. Unlike a pure multiple-expansion story, Micron’s earnings have genuinely exploded (FY25 net income of $8.5B vs $0.78B the prior year). If FY26/FY27 EPS keeps climbing, even a flat multiple supports a higher stock.
The Bear Case: Three Ways This Unwinds
1. The structural risk nobody is pricing: more memory-efficient AI models
This is the most important and most underappreciated bear argument. The entire trillion-dollar thesis rests on one assumption: that AI’s appetite for memory scales roughly linearly (or worse) with capability. History says that’s exactly the kind of assumption that breaks.
Memory — RAM in particular — was for decades treated as a pure commodity precisely because demand was predictable and supply eventually caught up. The AI era temporarily broke that framing by making demand look insatiable. But software has a long history of doing more with less hardware, and there are real, active research directions that could blunt memory demand:
- Smaller models matching larger ones. Distillation, better data, and improved architectures keep shrinking the parameter count needed to hit a given capability. A 30B model that matches yesterday’s 200B model needs far less memory.
- Aggressive quantization. Moving from 16-bit to 8-bit, 4-bit, or even lower-precision weights and KV caches cuts memory footprint several-fold with limited quality loss. This is already mainstream and still improving.
- KV-cache compression and sparse / linear attention. A huge share of inference-time memory is the KV cache for long contexts. New attention mechanisms and cache-eviction schemes directly attack the single largest memory consumer in modern inference.
- Mixture-of-Experts and conditional compute. Only activating a fraction of a model per token reduces the active memory bandwidth and footprint per query.
If even a couple of these compound, the industry could deliver more AI capability on less memory per unit of intelligence. The bull case implicitly assumes the “memory wall” stays the binding constraint forever. If algorithmic efficiency outpaces hardware demand, the AI premium on memory deflates — and Micron snaps back toward being valued like the cyclical commodity producer it has historically been. At a $1T market cap, that re-rating risk is enormous and asymmetric.
The counterpoint (and it’s a fair one): efficiency gains have historically increased total compute demand via Jevons’ paradox — cheaper inference means vastly more inference. Memory bandwidth, not just capacity, is also a stubborn bottleneck. So efficient models may simply unlock more usage rather than shrink the market. The honest truth is nobody knows which force wins, and that uncertainty alone argues against paying a permanent-supercycle multiple.
2. The classic memory cycle hasn’t been repealed
Every memory boom in history has ended the same way: high prices pull in record capex, supply overshoots, and prices collapse. Micron is guiding to a record ~$20B FY26 capex, and Samsung and SK Hynix are spending just as aggressively. New fabs (including Micron’s own Idaho/New York capacity) start coming online into 2027–2028. If AI hardware demand cools even modestly while that supply lands, the market can flip from shortage to glut quickly — and memory prices fall faster than they rise. A near-10x stock has zero margin for that.
3. Competition and a trillion-dollar valuation
Micron is the smallest of the big three. Samsung and SK Hynix have deeper pockets and have been fierce in HBM. If either pulls ahead on HBM4/HBM5 yields or capacity, Micron’s pricing power erodes. Meanwhile, China’s CXMT and others are climbing the DRAM ladder with state backing. Layer on a $1T valuation that already prices in years of supercycle, and the downside from any disappointment — a soft guide, an HBM share loss, a single weak DRAM pricing print — is severe.
Valuation: Priced for the Supercycle to Continue
The technicals make the valuation debate unavoidable. A 902.4% one-year move means the market has fully abandoned the old “memory is a cheap commodity” framework and is now valuing Micron as a structural AI winner. That can be the right call — but it is a call, and it is now the consensus, baked into the price.
The bull resolution is straightforward: if HBM stays contracted and sold out, if AI capex keeps compounding, and if Micron holds its node and packaging roadmap, earnings can keep climbing and the stock can grow into its valuation. The bear resolution is equally clean: any combination of a cyclical supply glut, an HBM share loss, or an efficiency-driven demand shock pulls Micron’s multiple back toward its commodity-cycle history — and from a trillion dollars, that is a long way down.
Key Risks
| Risk Factor | Why It Matters |
|---|---|
| Memory-efficient AI models | Distillation, quantization, KV-cache compression, and MoE could cut memory demand per unit of AI capability — directly undercutting the supercycle thesis |
| Cyclical oversupply | Record industry capex + new fabs into 2027–28 could flip shortage to glut and crater pricing |
| Valuation compression | At ~$1T, the stock prices in years of supercycle; modest disappointment can trigger a sharp de-rate |
| HBM competition | Samsung and SK Hynix are larger and aggressive; share or yield loss erodes Micron’s pricing power |
| China / new entrants | State-backed CXMT and others climbing the DRAM ladder threaten long-term supply balance |
| Technical extension | RSI near 70, price pinned to upper Bollinger band, 0% drawdown — little short-term slack |
| Capex / execution | $20B FY26 spend strains FCF if demand arrives slower than the buildout |
| Geopolitical exposure | China market access, export controls, and tariffs add tail risk |
Bottom Line
Micron’s technicals and fundamentals tell a coherent but demanding story: the AI memory supercycle we called in January was real, it was bigger than we dared model, and it has now carried Micron to a trillion-dollar valuation that prices in the cycle continuing.
From a technical standpoint, the trend is powerfully bullish — moving averages cleanly stacked, MACD still accelerating, stock at all-time highs. The caution flags are extension, not breakdown: RSI near overbought, price riding the upper Bollinger band, and a price far above its 50- and 200-day averages. This is a strong chart, but it is a late-stage one, and the -30.3% max drawdown during this rally is a reminder of how violent the pullbacks can be.
From a fundamental standpoint, our January thesis was directionally right and magnitudinally far too timid. The bull case — compounding AI demand, contracted HBM, the die penalty, U.S.-fab advantage — remains genuinely strong. But the bear case has sharpened in exactly the way that matters most at a $1T valuation: beyond the classic cyclical glut, there is now a real structural question about whether more memory-efficient AI models could deflate the demand assumption that justifies treating memory as something other than a commodity.
Investment assessment:
| Factor | View |
|---|---|
| Long-term outlook | Constructive if the supercycle is structural; fragile if it’s cyclical |
| Near-term technicals | Strongly bullish, but extended |
| Valuation | Priced for the supercycle to continue |
| Risk level | High |
| Best for | Investors who can stomach memory cyclicality, 30%+ drawdowns, and a trillion-dollar valuation |
The single most important thing to watch is not Micron’s next earnings beat — it’s whether AI’s memory intensity per unit of capability keeps rising or finally starts to fall. As long as bigger, more capable AI keeps needing proportionally more memory, the trillion-dollar story holds. The day the labs prove they can do more with less, the market will remember that RAM was always supposed to be a commodity.
Disclosure: This article is for informational purposes only and does not constitute financial advice. Technical data was sourced live via the Interactive Brokers API using the ib_insync Python library, latest daily bar dated May 29, 2026).