October 1, 2025
ATR vs Standard Deviation: Measuring Volatility in Day Trading
Volatility is a key factor for day traders, especially those trading fast moving markets like Nasdaq futures. Two popular tools to quantify volatility are Average True Range (ATR) and Standard Deviation. Both measure how much price fluctuates, but they do so in different ways. In this article, we’ll explain ATR and standard deviation, compare their pros and cons, and demonstrate with Python code and charts how each can be applied in day trading. By the end, you’ll know when to use ATR versus standard deviation for a clearer picture of market volatility.
Understanding Average True Range (ATR)
Average True Range (ATR) is a technical indicator that measures volatility in terms of absolute price movement. Developed by J. Welles Wilder, ATR looks at the trading range of each period (typically daily) including any gaps from the prior close. The first step is to calculate the True Range (TR) for each day, defined as the maximum of three distances:
- High – Low (the intraday range for the day)
- |High – Previous Close| (gap up from yesterday’s close, if any)
- |Low – Previous Close| (gap down from yesterday’s close, if any)
For example, imagine a stock that closed yesterday at $100 and today opened at $110 with a high of $115 and low of $105. The traditional intraday range would be High–Low = $115 – $105 = $10. However, because of the gap up, the true range considers yesterday’s close: High – Prev Close = $115 – $100 = $15. This larger value ($15) better reflects the real volatility for the day including the overnight jump. Once the true range is computed for each day, ATR is simply the moving average of the true range over a specified period (often 14 days by default). For instance, a 14-day ATR is the average of the last 14 true range values (Wilder’s original formula uses a smoothing technique, but the result is similar to a simple moving average after a few periods).
ATR is expressed in the same units as price (points or dollars). That makes it intuitive – if the 14-day ATR of Nasdaq futures is 50 points, it means the index has been moving about 50 points per day on average. ATR does not indicate price direction or trend; it only measures volatility magnitude. A rising ATR means volatility is increasing (prices are making larger moves), while a falling ATR indicates a quieter market. Traders often use ATR values to gauge the “normal” daily range of an asset. For example, “ATR = $2” on a stock tells us that over the past period the stock moved about $2 per day on average. This can help set expectations for intraday moves and is useful for setting stop-loss and profit target levels (more on that shortly).
Understanding Standard Deviation as a Volatility Measure
Standard Deviation (Std Dev) is a statistical measure of dispersion – it tells us how tightly or widely price changes are clustered around the average. In trading, standard deviation is often applied to daily returns or daily closing prices to quantify volatility. Mathematically, standard deviation is the square root of the variance, which is the average of the squared deviations from the mean. In simpler terms, if an asset’s daily returns have a high standard deviation, it means the returns vary greatly from the average (big swings up and down); a low standard deviation means returns are consistently close to the average, indicating low volatility.
When applied to price data, a higher standard deviation over a period indicates price is more volatile, while a lower standard deviation indicates more stable, range-bound price action. For example, if we calculate the standard deviation of the Nasdaq futures’ daily percent change over 20 days and get 1.2%, it implies an approximate volatility of 1.2% per day. (In statistical terms, if returns were normally distributed, roughly 68% of days would have returns within ±1.2%, and ~95% of days within ±2.4% – because ±2 standard deviations covers ~95% of observations.) Many popular indicators use standard deviation; Bollinger Bands, for instance, plot an upper and lower band at usually ±2 standard deviations from a moving average, creating volatility bands that contain most price movement.
One thing to note is that standard deviation is often calculated on closing prices or returns, which means it typically ignores intraday highs and lows and any gaps unless those affect the closing price. You can calculate standard deviation on any series (closing prices, returns, highs, etc.), but the most common usage in volatility context is the standard deviation of daily returns or closing prices. Unlike ATR which is in price points, standard deviation of returns is usually a percentage. This makes it a more abstract concept for some – it’s a statistical ratio rather than a dollar amount – but it has the advantage of being normalized, allowing you to compare volatility across different assets or time periods on a relative basis.
Python Example: Calculating ATR and Standard Deviation
Let’s see how we can compute and visualize ATR and standard deviation with Python. In this example, we’ll use daily price data (Open-High-Low-Close) and compute a 14-day ATR and a 14-day standard deviation of closing price changes. You can fetch real historical data using a library like yfinance (for demonstration, we use a synthetic sample resembling Nasdaq futures behavior):
import pandas as pd
import numpy as np

# Sample price data frame with columns: 'Open', 'High', 'Low', 'Close'
# Using a sample data frame for demonstration
dates = pd.date_range(start='2023-01-01', periods=100, freq='D')

open_prices = np.random.rand(100) * 100 + 10000
high_prices = open_prices + np.random.rand(100) * 50
low_prices = open_prices - np.random.rand(100) * 50
close_prices = open_prices + np.random.randn(100) * 20

data = pd.DataFrame({
    'Open': open_prices,
    'High': high_prices,
    'Low': low_prices,
    'Close': close_prices
}, index=dates)

# Ensure High is always greater than Low
data['High'] = data.apply(lambda row: max(row['High'], row['Low'] + 1), axis=1)
data['Low'] = data.apply(lambda row: min(row['Low'], row['High'] - 1), axis=1)


# Calculate True Range (TR) for each day
high_low = data['High'] - data['Low']
high_prev_close = (data['High'] - data['Close'].shift(1)).abs()
low_prev_close = (data['Low'] - data['Close'].shift(1)).abs()
data['TR'] = pd.concat([high_low, high_prev_close, low_prev_close], axis=1).max(axis=1)

# Compute 14-day ATR as the rolling average of TR
data['ATR_14'] = data['TR'].rolling(window=14).mean()

# Compute 14-day standard deviation of daily close-to-close returns
data['Return'] = data['Close'].pct_change()
data['StdDev_14'] = data['Return'].rolling(window=14).std()

# Inspect the latest values
print(data[['Close','ATR_14','StdDev_14']].tail())
This code calculates the true range and then the 14-day ATR. It also computes the 14-day standard deviation of daily returns. If we run this on a dataset, we might see output like:
                   Close     ATR_14  StdDev_14
2023-04-06  10049.660271  80.632053   0.006515
2023-04-07  10029.049150  79.567118   0.006335
2023-04-08  10047.451415  77.493291   0.006178
2023-04-09  10007.976447  75.567115   0.006250
2023-04-10  10095.932064  81.031095   0.006700
In the above snippet (which is hypothetical data for illustration), on March 1, the closing price is 95.61, the 14-day ATR is ~1.13, and the 14-day standard deviation of returns is ~0.0147 (i.e., 1.47% daily). We can also plot these to visualize how ATR and standard deviation behave over time:
Figure: ATR vs. standard deviation of volatility over time for a sample market. The 14-day ATR (green line, in price points) and the 14-day standard deviation of daily price changes (orange line, in price points) both rise as volatility increases. Notice the highlighted event (red dashed line) where a large intraday swing occurred with little net change in closing price – ATR spiked due to the day’s wide true range, while the standard deviation (based on closing prices) barely moved.
In the figure above, both ATR and standard deviation increase in volatile periods (early February in this example). However, at the marked event, there was a big intraday move that ATR captured (jumping sharply higher) while the closing price didn’t change much – thus the standard deviation of close-to-close changes stayed low. This illustrates a key difference: ATR accounts for intraday extremes and gaps, whereas standard deviation (if using only closes or returns) might miss volatility that doesn’t show up in closing prices.
ATR vs. Standard Deviation: Key Differences
ATR and standard deviation are not interchangeable measures of volatility. Here’s a breakdown of their differences:
- Intraday Range vs. Closing Prices: ATR’s big advantage is that it considers the full intraday range and any overnight gaps. This means ATR will register volatility even if price opens higher/lower or makes a big high-to-low swing in the session that ultimately closes where it started. Standard deviation in its common form uses only closing prices (or close-to-close returns). If an asset has wild swings but ends up closing roughly where it started, the standard deviation of closes could remain low while ATR will still be high. As one source puts it, “closing prices alone may not reflect the intraday volatility,” whereas ATR focuses on true range.
- Units – Absolute vs. Relative: ATR is expressed in absolute terms (e.g. points or dollars), which makes it easy to interpret for that specific instrument (e.g. “Nasdaq futures move ~50 points on average per day”). Standard deviation of returns is a dimensionless ratio (e.g. 1.5% per day). The latter is normalized – which is useful for comparing across different instruments or timeframes – but can feel abstract. ATR’s absolute values are straightforward (a beginner can intuitively grasp that ATR = 20 means a ~$20 daily move). The trade off is that ATR is not directly comparable between assets with very different prices (ATR of 20 on a $100 stock vs. 20 on a $1000 stock mean different relative volatility). In practice, traders sometimes convert ATR to a percentage of price for comparison, or use ATR Percent (ATR divided by price) as a normalized volatility measure.
- Calculation Method: Standard deviation involves squaring deviations, averaging, then taking a square root. This mathematically weights large deviations more heavily (outliers can significantly increase std dev). ATR, on the other hand, is essentially an average of absolute changes (no squaring), treating all volatility (big or small) in a linear fashion. One effect of this difference is that after a single huge price shock, standard deviation may spike more dramatically than ATR, since the shock’s impact is squared in variance. Conversely, ATR might be slower to react to one day spikes (especially if using Wilder’s smoothing) and will tend to reflect sustained volatility more than one off anomalies. Neither is “right” or “wrong,” but they respond slightly differently to volatility profiles (ATR is a smooth average of ranges, std dev is a statistical dispersion measure that can be more sensitive to outliers).
- Focus and Interpretation: ATR is non-directional – it doesn’t care if volatility comes from an up day or down day, it just averages the ranges (using absolute values). Standard deviation of returns also is direction-agnostic in that it measures variability (positive or negative deviations from the mean). However, standard deviation carries a bit more statistical context: traders and risk managers often think in terms of ±1σ, ±2σ moves (one or two standard deviations from the mean) to gauge how unusual a price move is, under an assumption of normal distribution. ATR doesn’t translate directly into probabilistic terms – it won’t tell you the likelihood of a move of a certain size – it’s more of a raw volatility gauge. For a day trader, ATR’s meaning is more concrete (“typical range is X points”) while standard deviation’s meaning is more conceptual (“volatility is X%, implying a ~1σ daily move of Y points”).
- Ease of Use: For most traders, ATR tends to be easier to visualize and apply. It comes from price differences you see on the chart, making it intuitive to use for setting stop distances or anticipating daily ranges. Standard deviation requires understanding the concept of variance and normal distribution; it may be more familiar to those with a statistics or finance background (it’s the basis of concepts like historical volatility and Sharpe ratios). One trading education source summed it up well: “ATR provides an intuitive sense of volatility, while standard deviation is more conceptual”.
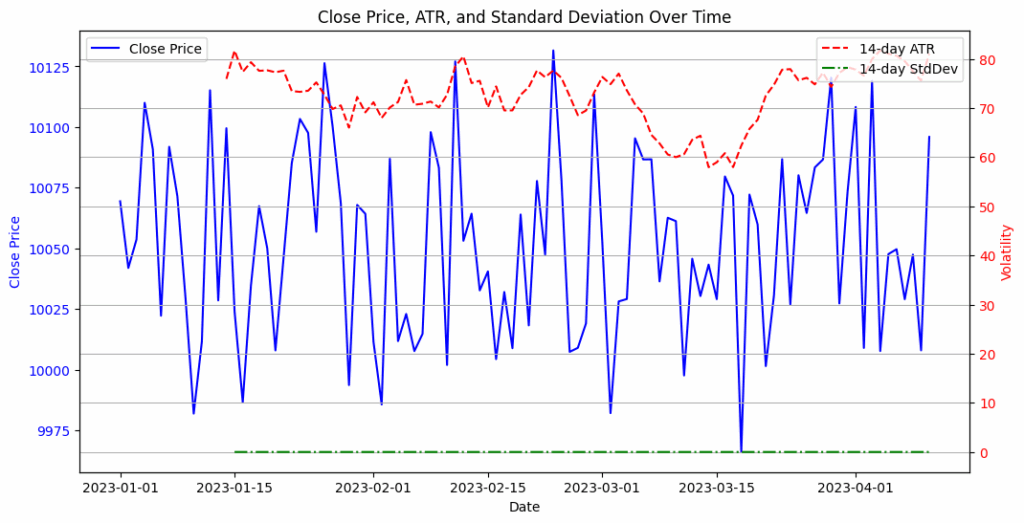
The plot showing Close Price, ATR, and Standard Deviation over time has been generated.
ATR captures more information about price movement (highs, lows, and gaps) and outputs it in an easy to digest form, which is why many traders consider ATR a better practical volatility measure for trading decisions. Standard deviation is a more general statistical tool – more flexible and with solid theoretical footing – but in its basic use on closing prices it might miss some aspects of volatility that ATR will catch. Neither is inherently “better” in all contexts; they have different strengths. As one trader noted, ATR and standard deviation aren’t really interchangeable due to their different constructions.
Pros and Cons of ATR vs. Standard Deviation
Let’s break down the advantages and disadvantages of each method:
Average True Range (ATR) – Pros:
- Captures Full Volatility (Intraday & Gaps): ATR includes intraday high-low swings and gap moves between sessions, giving a complete view of price movement. You won’t miss volatility that happens outside of market close-to-close. This makes ATR especially useful for instruments that gap overnight or have big intraday reversals.
- Easy Interpretation: ATR is expressed in points or dollars, making it very intuitive. Traders can readily understand and use it (e.g. “The past week, gold’s ATR is $15, so it’s been moving about $15 a day”). This helps in quickly gauging risk and setting expectations for trade moves.
- Practical Trading Utility: ATR is widely adopted in trading strategies for stop-loss placement and profit targets. Many find it useful for determining a reasonable stop distance or identifying breakout thresholds (for example, a breakout might be confirmed if price moves 1.5× ATR beyond a range). In fact, ATR is often the “indicator of choice” for setting trailing stops in systematic trading.
- Adaptability to Volatility Regime: Because ATR rises and falls with volatility, it can automatically adjust certain strategy parameters. For instance, position sizing can be adjusted using ATR – lower position sizes during high ATR periods to limit risk, and higher sizes when ATR is low (volatility is low). It essentially normalizes risk to the current volatility environment.
ATR – Cons:
- Not Normalized: ATR is asset-specific and scale-specific. A high-priced asset will have a higher ATR in absolute terms than a low-priced asset even if their volatility in percentage terms is the same. This makes direct comparisons difficult. You often must convert ATR to a percentage of price for cross-market comparison or to compare current ATR to historical ATR when price levels have changed significantly.
- No Direct Statistical Context: Unlike standard deviation, ATR doesn’t come with probabilistic interpretation (e.g., you can’t directly say “within 2 ATR covers 95% of moves” in a theoretical sense). There’s also no strong mathematical theory behind ATR – it’s an empirical indicator introduced by traders, not statisticians. This isn’t necessarily a problem, but ATR is more of an empirical heuristic than a statistically defined measure.
- Lagging Indicator: ATR uses a moving average, so it reacts with a lag to sudden volatility changes. If there’s a sharp increase in volatility, ATR will rise, but a 14-day ATR will rise gradually as the new high-TR values replace older ones. Traders often compensate by using shorter ATR periods for a quicker response, but then the ATR line can get choppier. There’s a trade-off between smooth ATR and responsive ATR.
- Ignores Direction and “Sign” of Moves: ATR treats upside and downside volatility the same (it takes absolute ranges). While this is generally a pro for volatility measuring, sometimes a trader might want to distinguish between wild swings that are whipsawing versus steady trend moves. ATR won’t tell you if volatility came from an uptrend or a crash – just that volatility increased.
Standard Deviation – Pros:
- Statistically Meaningful: Standard deviation is a well founded measure in statistics. It ties into probability theory – under assumptions of normality, one can make probabilistic statements about price moves. For example, knowing the daily standard deviation of returns allows estimation of the likelihood of a move of a certain size (the basis for Value-at-Risk and other risk metrics). It provides a common language for volatility used in finance (annualized volatility, Sharpe ratio calculations, etc., are all based on standard deviation).
- Comparability: Because standard deviation of returns is dimensionless (a percentage), it allows comparison across different assets or timeframes. You can compare a 2% daily volatility stock to a 1% daily volatility index easily. It also scales with time in a known way (e.g., roughly √T scaling for independent returns), so you can annualize a daily std dev (~16% annual vol if daily std dev is 1%). ATR doesn’t offer that without conversion.
- Flexible Application: You can apply standard deviation to any data series you want – returns, price levels, high prices, etc. In technical analysis, standard deviation can be used to measure volatility of indicators or spreads, not just price. For example, Bollinger Bands use the standard deviation of closing prices around a moving average, and you could similarly measure volatility of an indicator or an equity curve. This flexibility is useful for system designers. (By contrast, ATR has a fixed definition based on price ranges.)
- Broad Adoption in Indicators: Many volatility-based indicators and strategies are built on standard deviation. Apart from Bollinger Bands, think of statistical arbitrage strategies, which often assume returns revert to a mean measured in standard deviation units, or options trading where implied volatility is essentially a standard deviation of returns expected by the market. If you want to connect your volatility measure to these areas, standard deviation is the common denominator.
Standard Deviation – Cons:
- May Underestimate True Volatility (if using closes only): The classic critique from traders is that standard deviation (of daily closes) misses intraday action and gaps. If most of your volatility happens during the trading day but reverts by close, std dev sees little change. ATR was basically invented to solve this issue for commodities traders. For example, a stock that whipsaws 5% intraday but closes unchanged for several days in a row will show near-zero standard deviation of closes but a high ATR – because volatility was present even though closes didn’t change. Similarly, a gap that is subsequently filled in the same day registers in ATR but a closing-based std dev might only see the net result.
- Abstract for Beginners: Standard deviation is not as straightforward as saying “stock moves $2 a day.” It requires understanding the idea of dispersion around a mean. New traders can find it less intuitive – volatility = 1.5% doesn’t immediately tell a beginner what that means in terms of dollar moves unless they do additional mental math. ATR’s output is more concrete for a single market.
- Assumes Stable Distribution (for significance): The interpretation of standard deviation (like the 95% rule) technically relies on a roughly normal (bell-curve) distribution of returns. Real market returns often have fat tails (extreme moves more frequent than normal). So a “2 standard deviation move” might occur more often than 5% of the time in practice. Traders need to be aware of this – standard deviation is a blunt instrument in this regard. ATR doesn’t make any distribution assumption; it just reports average range. In extreme conditions, both ATR and std dev will rise, but standard deviation might still underpredict the probability of outliers if one assumes normality.
- Can Be Influenced by Trends/Drift: If you apply standard deviation to actual price levels (not returns), an upward or downward trend can inflate the standard deviation even if the percentage volatility is constant. Usually traders use returns to avoid this, but it’s a consideration. ATR (taking differences) inherently focuses on day-to-day changes, removing long-term trend drift.
In short, ATR is trader-friendly and holistic (capturing all price movement), while standard deviation is analytically rich but can be incomplete in capturing the trading experience. Many trading platforms and educators therefore favor ATR for things like setting stops, while standard deviation remains a go-to for analysts looking at historical volatility or devising probability-based strategies.
Use Cases and When to Use ATR vs. Standard Deviation
Both ATR and standard deviation have their place in a trader’s toolkit. Here are some common use cases and recommendations for when each is most appropriate:
When to Use ATR:
- Setting Stop-Losses and Profit Targets: ATR shines in helping traders set adaptive stops and targets based on market volatility. For example, a trader might set a stop loss at 1.5× ATR below their entry price to give the trade room to breathe in a volatile market. If Nasdaq futures ATR is 100 points, a 1×ATR move (100 points) is relatively “normal” noise – so a stop 1×ATR away might be hit too easily, whereas 2×ATR might be a better buffer. Many trading systems use rules like “trail a stop at 2×ATR from the recent high/low.” In the earlier example from a source: trailing stops often use ATR by setting stop at Close – 2×ATR for long positions. This adjusts the stop distance to current volatility – wider stops when volatility is high, and tighter stops when volatility is low.
- Position Sizing (Risk Management): Traders can use ATR to scale position sizes such that a 1 ATR move equals a certain percentage of their capital. For instance, if you are willing to risk 1% of your account on a trade, and ATR is $2 (for a stock) on daily timeframe, you might size the trade so that $2 move (typical daily swing) is $X of your capital = 1%. In more volatile markets (higher ATR), you take smaller positions to keep the dollar risk constant. This is common in futures and forex trading – e.g., if two currency pairs have different ATR (volatility), a trader might trade fewer lots of the more volatile pair.
- Detecting Market Regime (Quiet vs. Volatile): By watching ATR, traders can tell when the market is transitioning from a low volatility range to a high volatility phase. A very low ATR value indicates a tight trading range – often a buildup before a breakout – whereas a rising ATR may confirm that a breakout or trend is underway. For example, if Nasdaq futures ATR has been 50 points and suddenly climbs to 120 points, the market has entered a much more volatile regime, possibly due to a news event or breakout. Range-bound strategies might be avoided in such conditions, whereas trend following strategies might thrive.
- Intraday Trading and Scalping: For very short-term traders, ATR can be calculated on intraday charts (e.g. 30-minute ATR, 5-minute ATR) to gauge how much movement to expect in a given time window. A scalper might use a 5-minute ATR to decide on a reasonable profit target (e.g. aiming for half the ATR on a quick trade). ATR is timeframe-specific, so a 5-minute ATR might be, say, 2 points on an index, telling a scalper that a 2-point move is normal in that interval.
- Channel Breakout Indicators (e.g. Keltner Channels): Keltner Channels are volatility bands similar to Bollinger Bands, but they use ATR for band width instead of standard deviation. These channels (commonly set at, say, 2×ATR above and below a moving average) help identify breakouts – when price pushes outside the ATR-based channel, a significant move may be underway. The use of ATR here ensures the channel adapts to recent volatility. Traders who prefer ATR’s intraday sensitivity might choose Keltner Channels, whereas Bollinger Bands (std dev based) respond differently to price clustering. Neither is strictly better – just a different flavor of volatility measure in action.
In essence, ATR is recommended when you want your trading decisions to account for actual price ranges and current volatility conditions. It’s very popular among technical traders for stop placement and strategy filters. As one article’s bottom line noted, ATR’s incorporation of intraday action and intuitive nature make it invaluable for guiding many aspects of trading.
When to Use Standard Deviation:
- Measuring Historical Volatility (for Risk Analysis): If you want to quantify how volatile an asset has been in a traditional sense (like for risk models or option pricing), you’ll use standard deviation of returns. For example, a risk manager might say “the stock has a 20% annualized volatility,” which is derived from the standard deviation of daily returns. ATR isn’t used in these contexts. Standard deviation is the language of volatility in portfolio theory and derivatives. When trading Nasdaq futures, if you’re considering options or comparing it to other assets, you’d likely look at standard deviation or its derivative (variance or VIX for implied vol).
- Relative Performance and Cross-Asset Comparison: Let’s say you’re trading a portfolio of different futures (Nasdaq, S&P, Gold, Oil). ATR values are not comparable due to different price scales. Instead, you’d look at each instrument’s volatility in percentage terms via standard deviation. This could inform, for instance, how to allocate capital or which market is relatively more volatile this month. Standard deviation provides a normalized measure so you can compare volatility of Nasdaq vs. volatility of Crude Oil, even though their prices and ATRs are on different scales.
- Bollinger Bands and Mean Reversion Strategies: If you use Bollinger Bands (20-day SMA ± 2 standard deviations is a classic setting), you are implicitly using standard deviation as your volatility gauge. Bollinger Bands are great for visualizing when price deviates significantly from its recent average – something ATR doesn’t do because ATR isn’t tied to a mean. For mean reversion traders, measuring how many standard deviations away from the mean a price is can signal an overbought/oversold condition (e.g., price closing 3σ above its 20-day average might be considered unusually high in a normal market). ATR isn’t used for this type of signal; standard deviation is the go-to.
- Volatility Targeting and Strategy Calibration: Some trading strategies adjust their exposure to maintain a target volatility. For example, a strategy might aim for a steady 10% annualized volatility on returns – it will increase or decrease trade size based on the realized standard deviation of returns. In such cases, using standard deviation of returns is natural. If you tried to use ATR for this, you’d have to convert ATR to a return metric anyway. So whenever it comes to quantitative strategy design with volatility as a parameter, standard deviation (and variance) is typically used.
- Option Trading and Probabilistic Scenarios: If you trade options on futures, you care about implied and historical volatility in std dev terms. Scenarios like “what is the probability that Nasdaq will be above X in 5 days?” will involve standard deviation of returns. ATR doesn’t directly factor in, since it’s not used in option pricing formulas. However, ATR can complement by giving a quick sense of daily range, but any serious probability analysis will revert to standard deviation.
In summary, use standard deviation when you need a standardized, statistically interpretable volatility measure – comparing across markets, plugging into formulas, or analyzing deviations from a mean. It’s the preferred measure in academic and quantitative discussions of volatility.
Using Both Together: These metrics are not mutually exclusive. Some traders watch both. For instance, you might use ATR for trade management (stops/targets) and also keep an eye on a 30-day standard deviation to understand the broader volatility environment or to compare against implied volatility from options. If the two measures diverge (e.g., ATR is climbing but standard deviation of closes isn’t, it could mean volatility is coming more from intraday swings than closing price changes), that itself is information about market behavior.
For a beginner trading Nasdaq futures, a reasonable approach is to rely on ATR for day-to-day trading decisions (since it directly relates to price movements you see and feel intraday) while understanding standard deviation as a background measure of overall volatility (especially if you venture into any options or if you want to measure your strategy’s performance volatility).
Conclusion
ATR and standard deviation each offer a lens on volatility – one from a trader’s perspective of price ranges, and the other from a statistician’s perspective of data dispersion. Neither is inherently “better” across all scenarios; they excel in different applications. The Average True Range “stands out for its intuitive interpretation and incorporation of intraday price action,” making it a staple tool for active traders. It helps in crafting trading strategies that adapt to market rhythm – from setting stops to sizing positions – by accounting for the actual range of price movement. Standard deviation, on the other hand, remains the foundation for volatility analysis in finance, allowing comparisons across markets and linking to probability and risk management frameworks.
In practice, day traders (especially beginners on instruments like Nasdaq futures) will find ATR extremely useful for understanding market noise and planning trades within realistic daily ranges. Standard deviation can complement this by providing insight into the volatility climate and informing any strategy where relative or normalized volatility matters. By leveraging ATR vs. standard deviation at the right times, you gain a more complete picture of volatility – ATR for the boots-on-the-ground view of price swings, and standard deviation for the big-picture and cross-market view of volatility. Armed with both tools and the Python examples above, you can measure and navigate market volatility with greater confidence and precision.
References:
Investopedia. Average True Range (ATR) Definition. – Defines ATR and its use in technical analysis.
Gustafson, G. (2001). Average True Range To Measure Volatility? Which Volatility Measure? Technical Analysis of Stocks & Commodities. – Explains ATR vs. standard deviation and notes ATR’s inclusion of intraday data and gaps.
Markets.com Trading Education (2024). ATR Versus Alternative Volatility Indicators. – Discusses ATR calculation and advantages for traders, comparing it with standard deviation (ease of interpretation, intraday focus).
Futu Blog (2024). ATR Indicator: Check price movements, set stop profit and loss. – Provides an example of ATR calculation with a gap and how traders use ATR for setting stops and targets.
CMC Markets Guide. Average True Range (ATR). – Describes ATR and mentions differences from standard deviation (calculation periods, interpretation).